Delaney O’Kray-Murphy, EBRC research economist
Valorie Rice, senior business information specialist
Alexandra Jaeger, EBRC web applications developer
Current data releases as of 30 June 2023
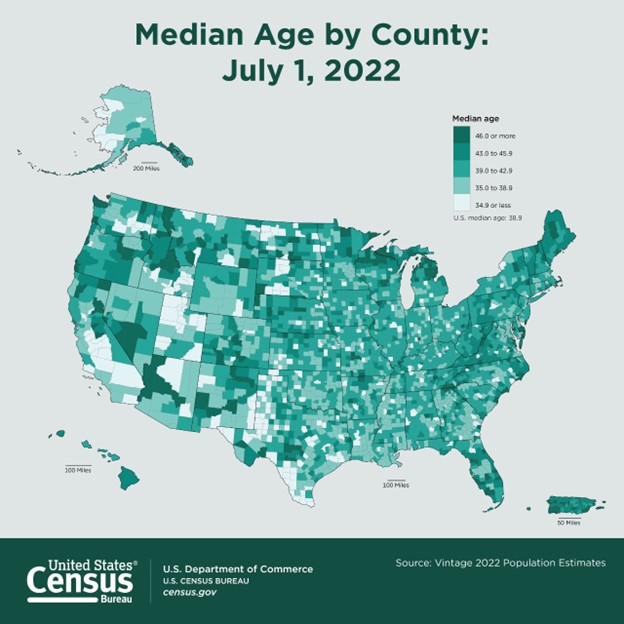
The median age in Arizona for 2022 was 38.7 years old, which was still a bit lower than the nation at 38.9. The most recent 2022 population estimates for states and counties including detailed age, race, and ethnicity was released June 22 and indicated that the median age of the nation continues to increase. The state with the youngest median age was Utah at 31.9 years while the oldest state was Maine at 44.8 years. Coconino was the youngest county in Arizona for 2022, at 32.7 years. It also had the distinction of having the greatest change in median age, moving up 1.1 years between the 2020 Census and the 2022 population estimates. No county in Arizona experienced a decrease in median age, though Pinal County, at 40.1 years, had no change. There were six counties in the state with a median age over 40 years: Pinal (40.1), Cochise (42.3), Gila (51.2), Mohave (53.3), Yavapai (55.1) and La Paz (58.5). The two largest counties in the state, Maricopa and Pima, have median ages just under 40 at 37.5 years and 39.5 years, respectively.
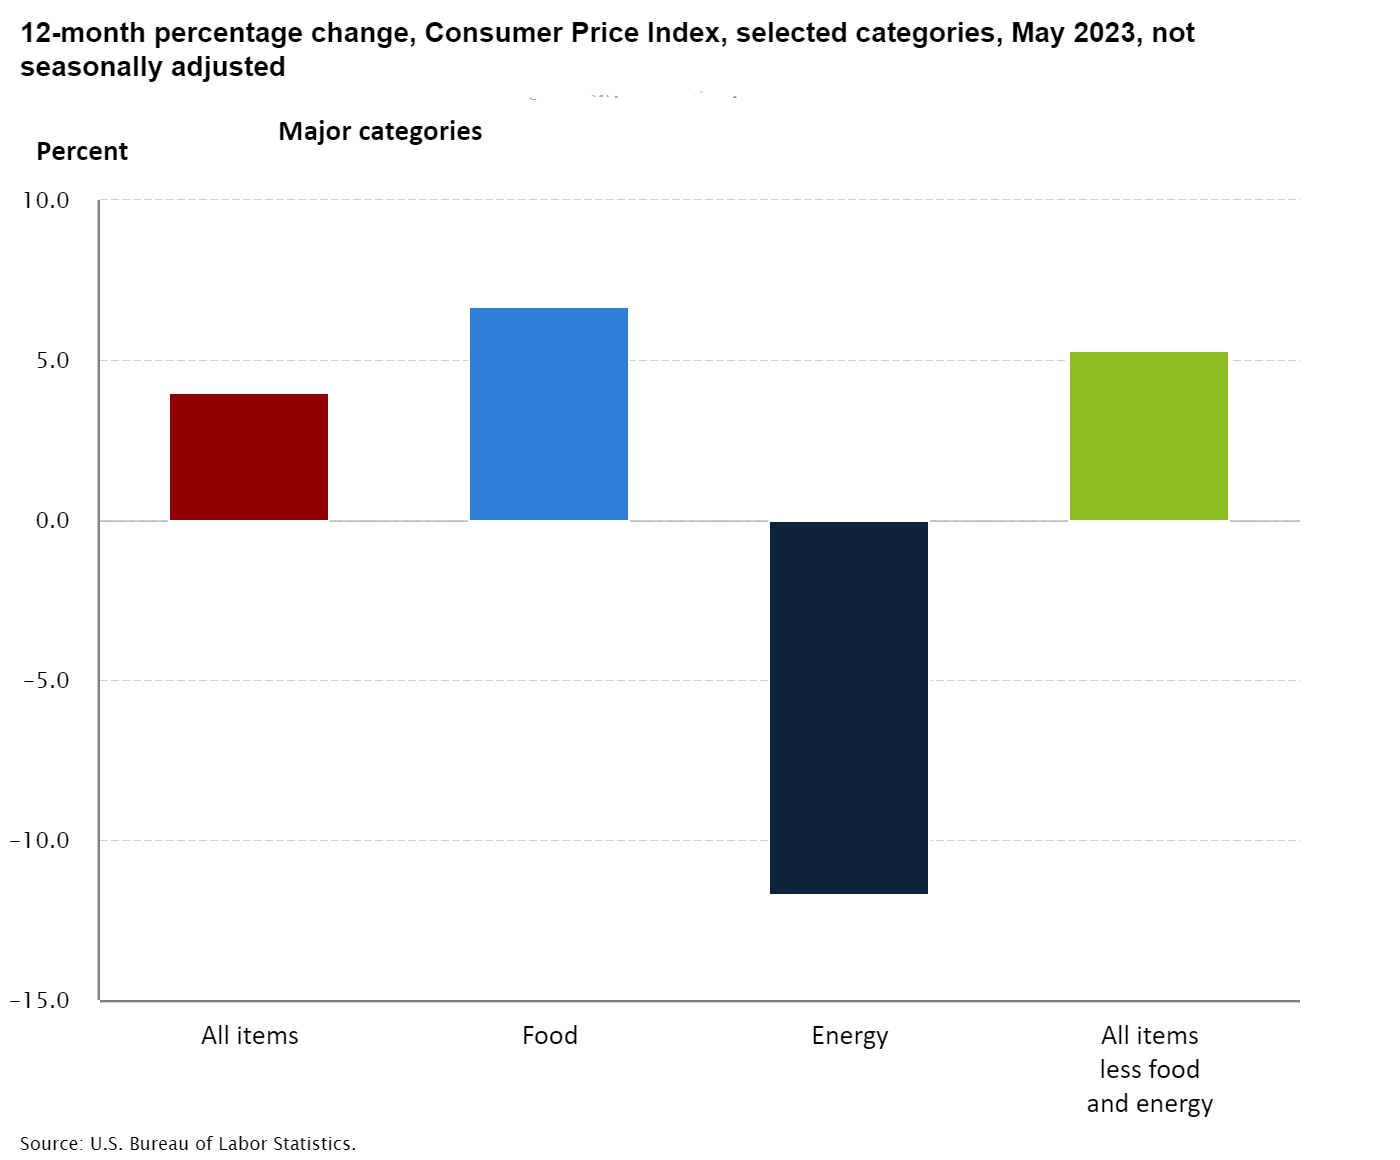
The Consumer Price Index was up 0.1% over the month in May on a seasonally adjusted basis after rising 0.4% in April. The largest contributors to the monthly change in prices were shelter and used cars and trucks. Energy prices were lower in May, declining 3.6%. The index for all items less food and energy increased 0.4% in May, the same rate as the last three months in a row. Inflation eased to 4.0% in May, the lowest it has been since March 2021. The 12-month change in May for all items less food and energy was 5.3%. Energy prices decreased 11.7% over the last year while food prices increased 6.7%.
Arizona was among the three states with an increase in the number of quits for April according to the June 21 State Job Openings and Labor Turnover (JOLTS) report. Quits are voluntary separations that do not include retirements or transfers. Job openings rates decreased in April for two states, increased in 13 states, and were little changed in all other states. The job opening rate for Arizona grew to 7.0% after increasing to 6.3% in March from 5.7% in February. Nationally, the total separation rates were little changed, as were both job openings and hires.
Producer prices decreased 0.3% in May on a seasonally adjusted basis. The Bureau of Labor Statistics Producer Price Index May report indicated final demand goods declined 1.6% over the month, with falling energy prices being the primary motivator for the decrease as the final demand energy index fell 6.8%. Final demand services on the other hand, rose 0.2%. Final demand less food, energy, and trade was unchanged for the month. The 12-month change in final demand producer prices has been trending down since June 2022 when it was 11.2%, reaching 1.1% in May, unadjusted.
House prices in Phoenix and nationwide crept up in April. Home prices peaked nationally in June 2022, declined until January 2023, and have been steadily rising since. While the indices both rose over the month, they both have shown yearly decreases, with Phoenix showing a 6.14% decline and the national home price index reporting a 0.2% annual decrease. Miami, Chicago, and Atlanta reported the highest year-over-year gains, with year over year price increases of 5.2%, 4.1%, and 3.5%, respectively. Seattle and San Francisco posted the greatest declines at 12.4% and 11.1%, respectively. The southeast represents the strongest region for home price growth in the country, posting a 3.6% price growth, while the west holds the weakest position, showing a 6.9% decline over the year.
Building permits in Arizona experienced a significant decline over the year in May, dropping by 13.9% to a total of 4,534 permits, non-seasonally adjusted. The Phoenix metropolitan area accounted for the majority with 3,402 permits, representing a 15.7% decrease compared to May of the previous year. On the other hand, the Tucson metropolitan area reported 450 permits, defying the trend with a 3.0% growth. Among the counties, Apache County and Coconino County experienced increases in the total number of building permits. Conversely, several counties including Cochise County, Gila County, Mohave County, Navajo County, Pinal County, Santa Cruz County, Yavapai County, and Yuma County witnessed year-over-year decreases in their total housing units. Graham County and La Paz County did not observe any changes in this regard.
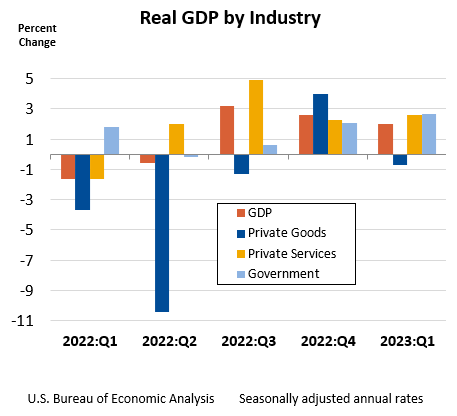
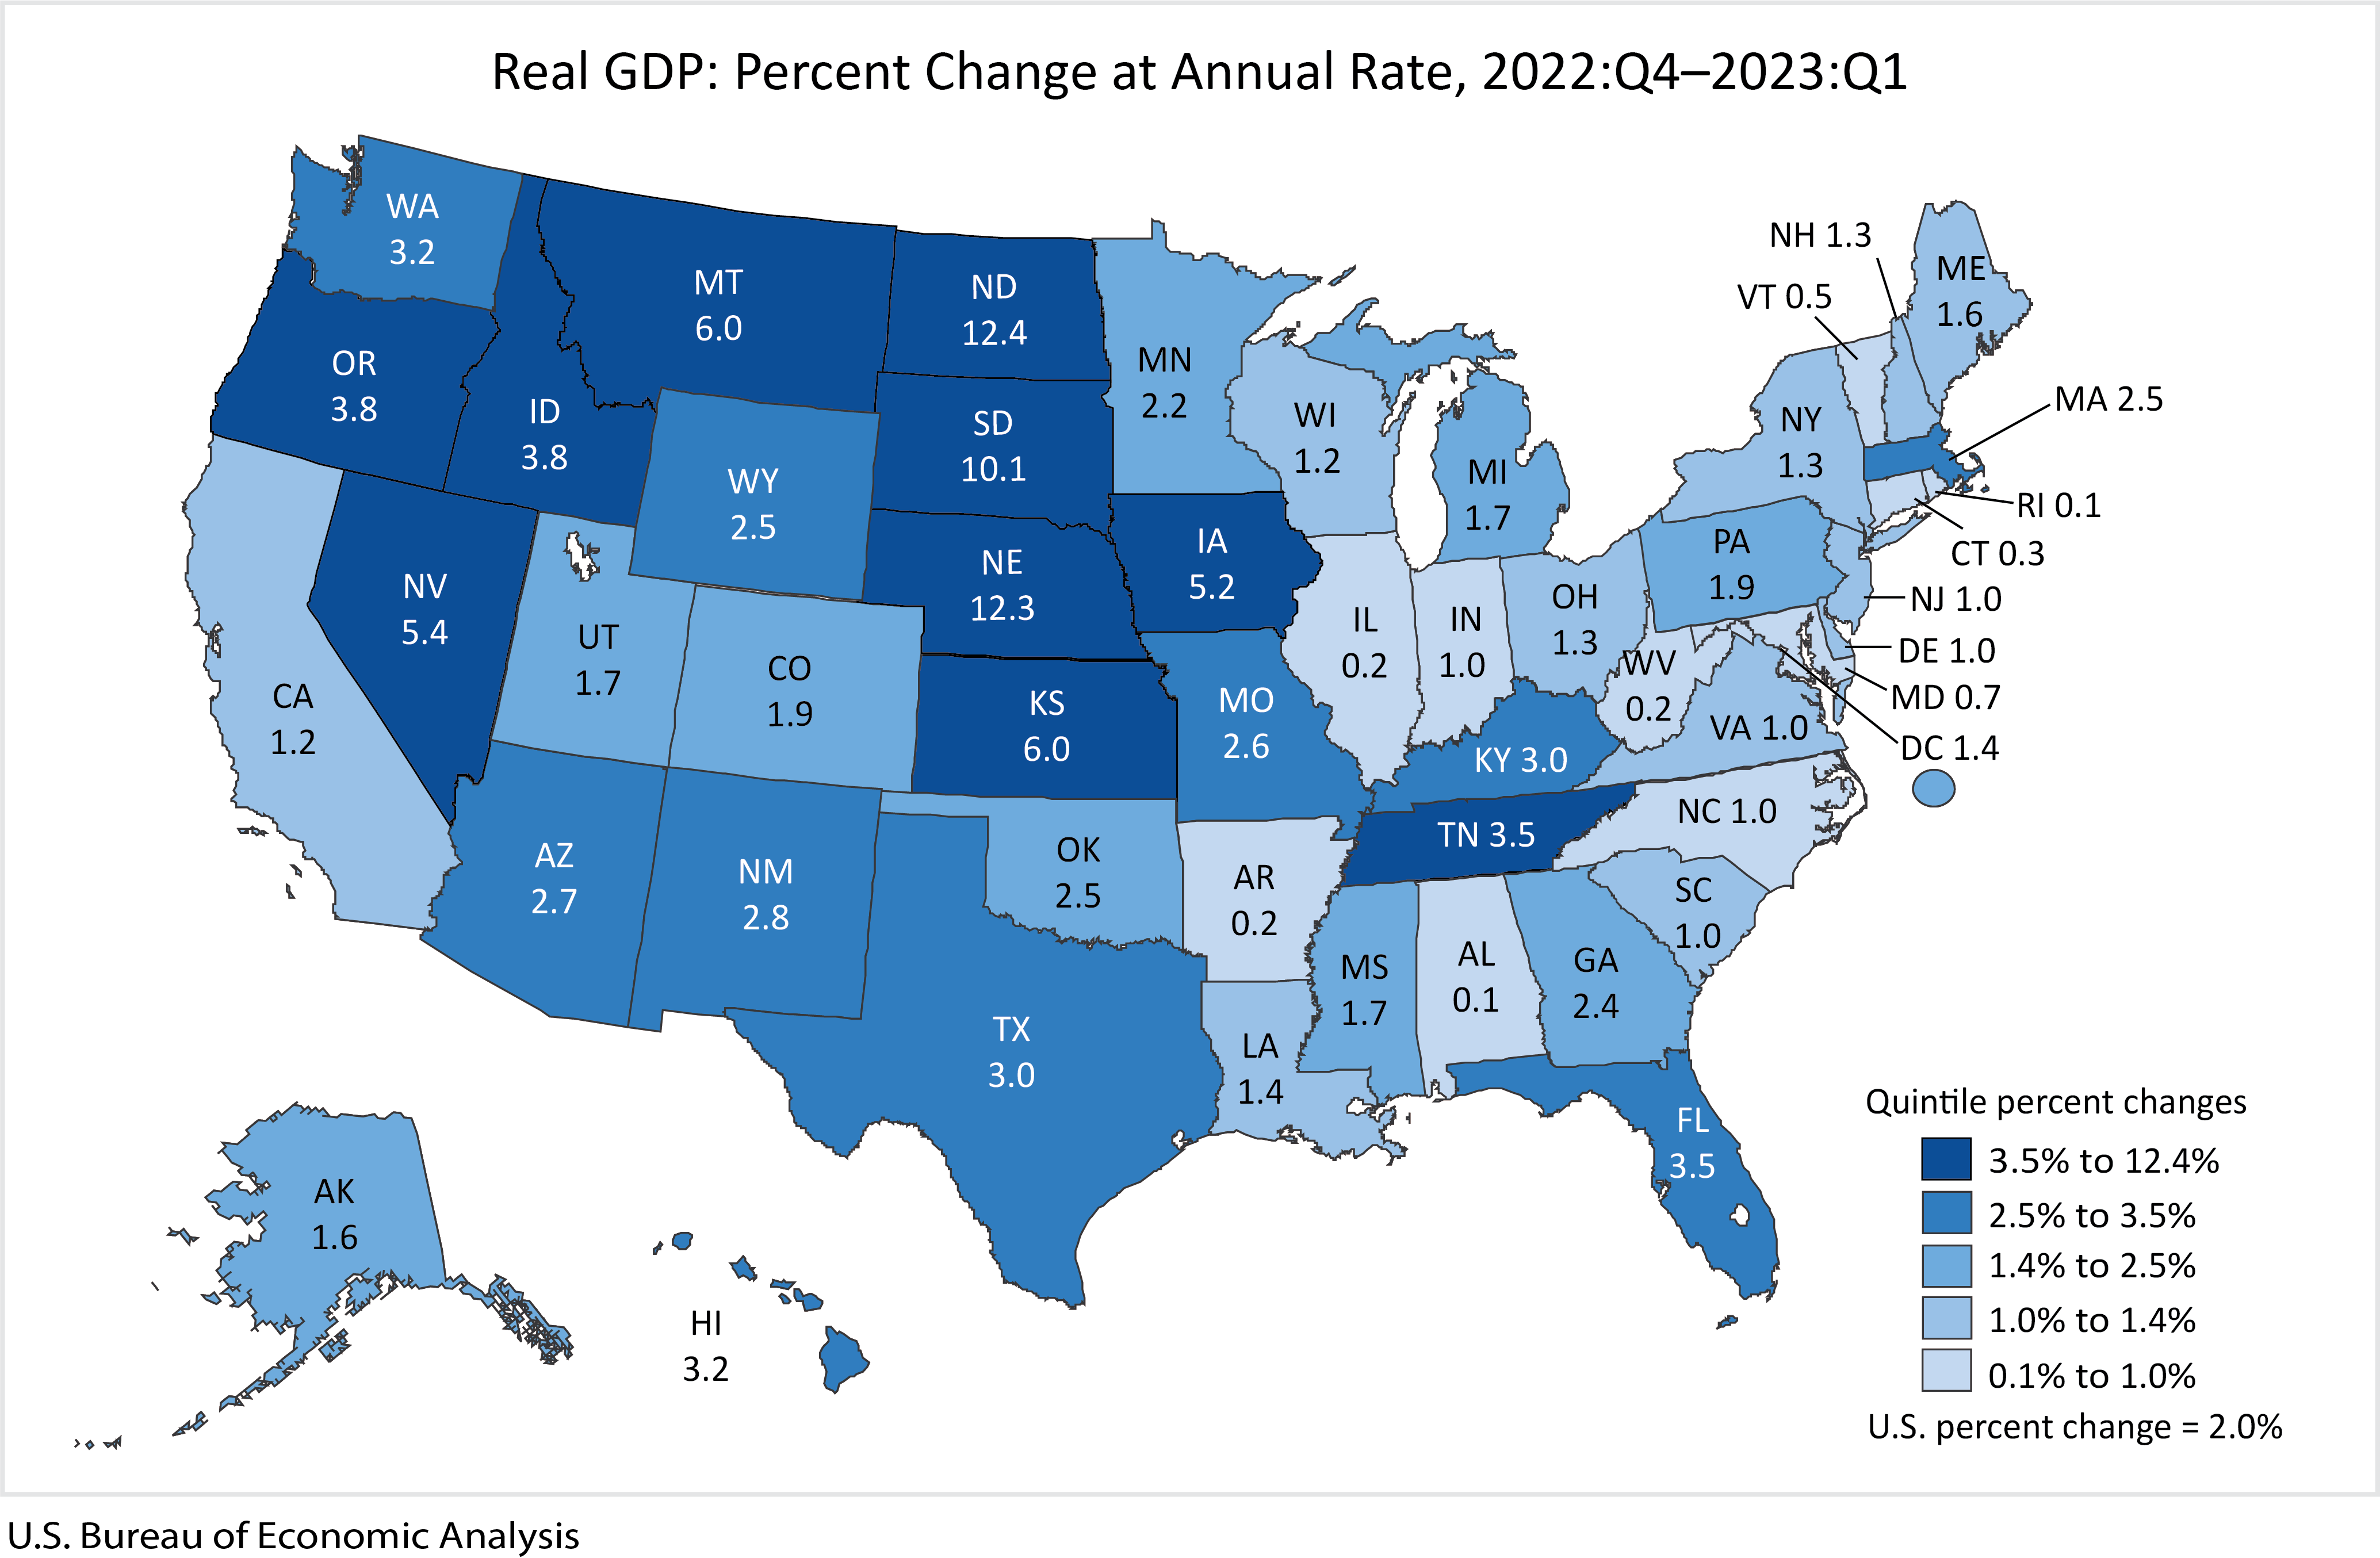
U.S. real GDP increased at an annual rate of 2.0% in the first quarter or 2023, a 0.7 percentage point upwards revision, according to the third estimate by the U.S. Bureau of Economic Analysis. Current-dollar GDP and real GDI both saw upwards revisions in this release; however, real GDI, which moved up 0.3 percentage points from the second estimate, remains in negative territory at -1.8%, marking the second quarter of negative real GDI. This release also includes a breakdown of real GDP growth by industry, with private services-producing industries increasing 2.6%, government growing 2.7%, and private goods-producing industries decreasing 0.7%. Within private services-producing industries, health care and social assistance; retail trade; real estate and rental leasing; and accommodation and food services led the growth, which was partially offset by decreases in finance and insurance. Within private goods-producing industries, durable and nondurable goods manufacturing both saw declines that were partially offset by an increase in agriculture, forestry, fishing, and hunting.
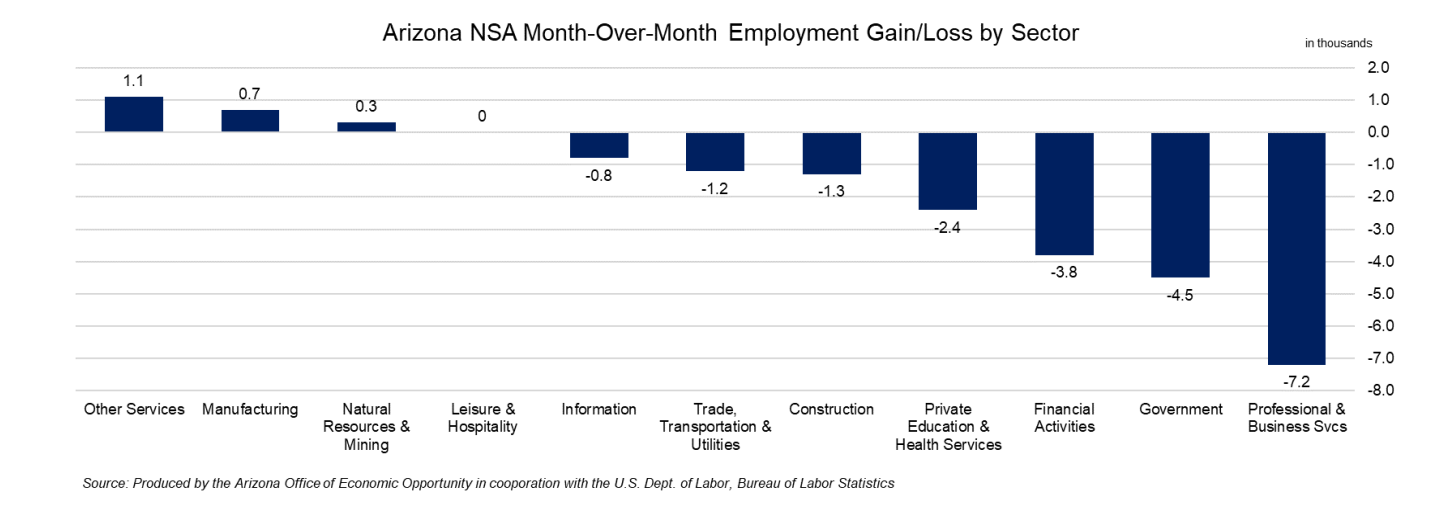
Arizona’s seasonally adjusted unemployment rate remained steady at 3.4% in May, seasonally adjusted, maintaining its lowest level since 1976. However, the U.S. unemployment rate experienced a slight increase of 0.3 percentage points, reaching 3.7%. Arizona’s seasonally adjusted labor force grew over the year while the total seasonally adjusted nonfarm employment decreased, seeing changes of 8,964 (0.2%) and 3,300 (-0.1%), respectively. Additionally, Arizona’s non-seasonally adjusted nonfarm employment declined by 19,100 jobs in May, surpassing the pre-pandemic average of 6,700 job losses. Notably, the private sector encountered the most significant job losses, with a reduction of 14,600 positions, primarily in Professional and Business Services (-7,200) and Financial Activities (-3,800). The public sector shed 4,500 jobs in May, performing better than the pre-pandemic average of 5,700 job losses. Overall, there were employment gains in Other Services (+1,100); Manufacturing (+700); and Natural resources and Mining (+300). Job losses occurred in Professional and Business Services (-7,200); Government (-4,500); Financial Activities (-3,800); Private Education and Health Services (-2,400); Construction (-1,300); Trade, Transportation, and Utilities (-1,200); and Information (-800).
Metropolitan area unemployment rates were lower than the prior year in May for 177 of the 389 metropolitan areas, higher for 158 areas, and unchanged in the remaining 54. The national unemployment rate was 3.4%, the same as May 2022, non-seasonally adjusted. The lowest jobless rate for the month occurred in Burlington-South Burlington, Vermont with 1.3%, while El Centro, California, achieved the highest rate of 16.0%, according to the June 28 release. The Arizona unemployment rate hit 3.6% in May; 0.1 percentage points lower than the prior year. The Metropolitan area unemployment rates came in at 3.7% for Flagstaff, 4.1% for Lake Havasu City-Kingman, 3.3 for Phoenix-Mesa-Scottsdale, 3.4% for Prescott, 4.3% for Sierra Vista Douglas, 3.6% for Tucson, and 12.3% for Yuma. All of these were the same or lower than May 2022 unemployment, except for Yuma, which was 0.1 percentage points higher.
Arizona Real GDP increased by 2.7% at an annual rate from the fourth quarter 2022 to the first quarter 2023, according to the Bureau of Economic Analysis June 30 release. This ranked Arizona 17th in the nation- part of the second highest quintile- for growth. Real estate and rental and leasing was the largest industry contributor to percent change in Arizona, contributing 0.89 percentage points, followed by health care and social assistance at 0.86, state and local government at 0.47, and professional, scientific, and technical services at 0.35. two industries saw shrinkage that detracted from state GDP: management of companies and enterprises (-0.05) and other Real estate and rental and leasing was the largest industry contributor to percent change in Arizona, contributing 0.89 percentage points, followed by heath care and social assistance services (-0.07). Real GDP increased in all 50 states and the District of Columbia in the first quarter 2023. Rhode Island and Alabama ranked last with 0.1% GDP growth, and North Dakota achieved the top position with a GDP growth rate of 12.4%. The nation saw a 2.0% increase.
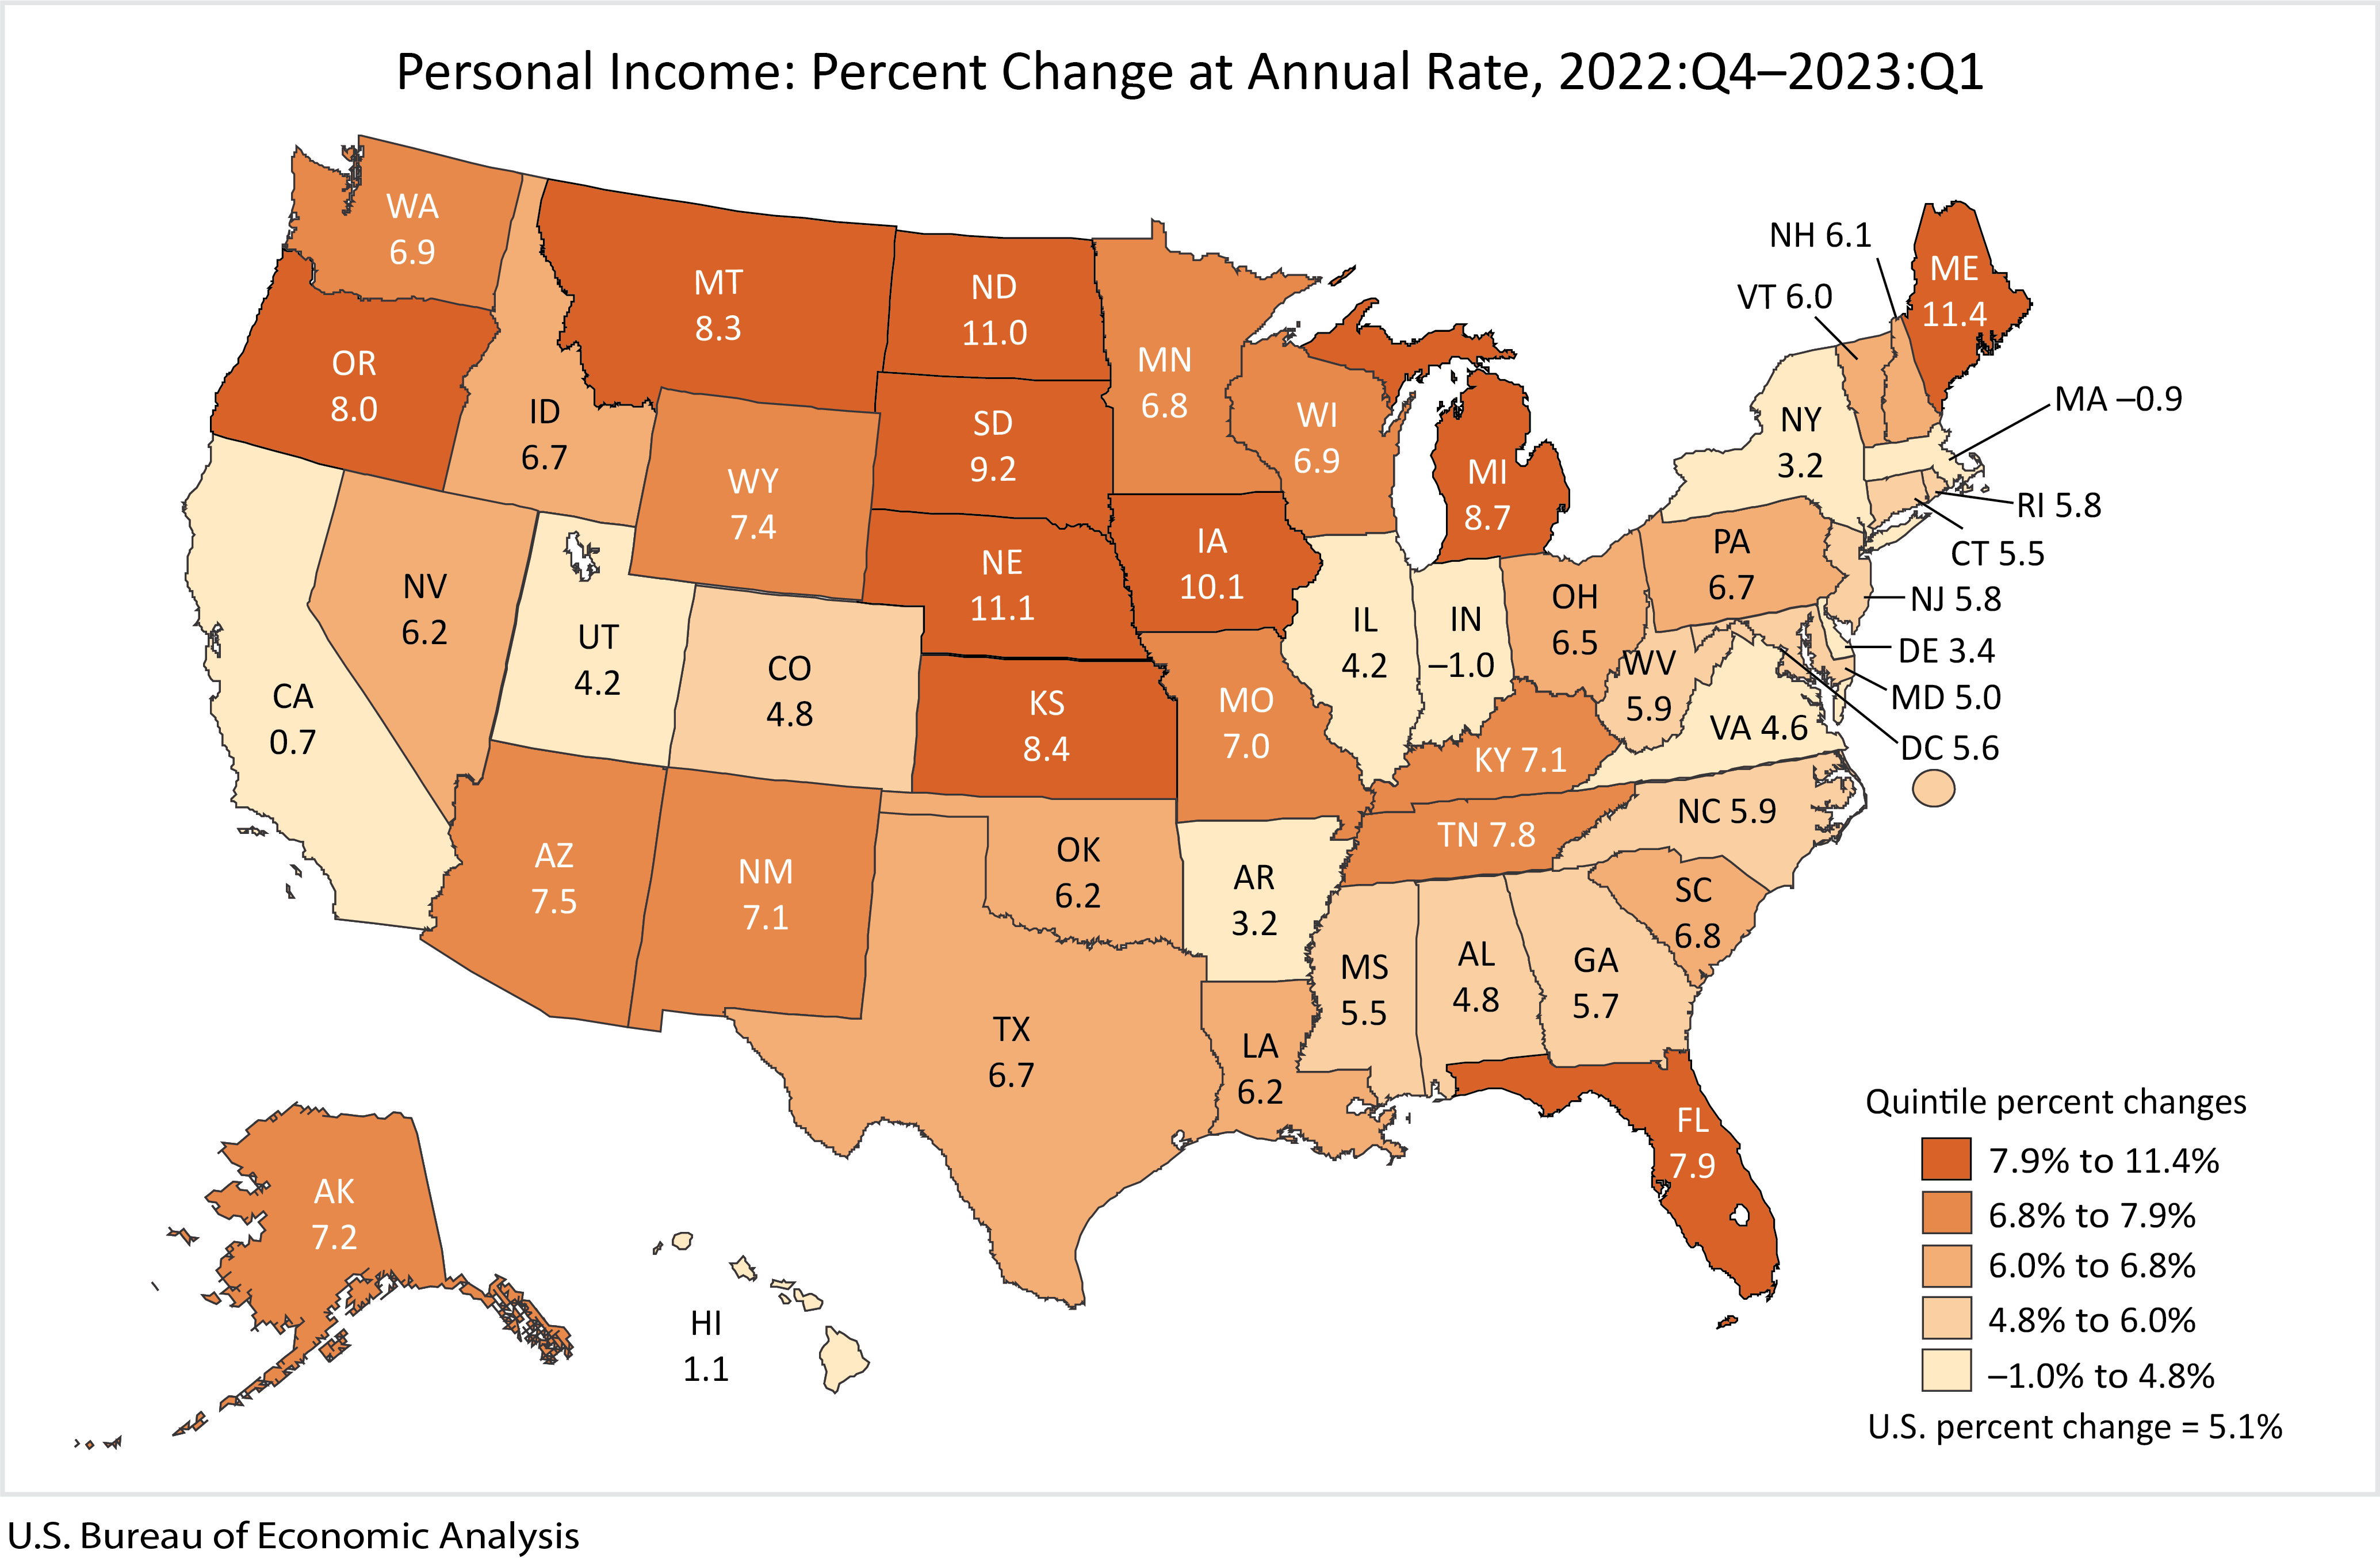
Arizona personal income grew at an annual rate of 7.5% in the first quarter 2023. Arizona ranked 12th in the nation, placing it in the second highest quintile. During this period, the nation grew at an annual rate of 5.1%. State personal income increased in 48 states and the District of Columbia and fell in two states: Indiana (-1.0%) and Massachusetts (-0.9%). Maine ranked first in the nation with an increase of 11.4%. The growth in Arizona’s personal income was foremost driven by increases in transfer receipts, contributing 3.4 percentage points, followed by net earnings with 2.7, and dividends, interest, and rent with 1.4. Notably, the cost-of-living adjustments to social security served as the primary driver for the increase in transfer receipts nationally.