
Delaney O’Kray-Murphy, EBRC research economist
Valorie Rice, senior business information specialist
Alexandra Jaeger, EBRC web applications developer
Current data releases as of 21 July 2023
There were 814 bankruptcy filings in Arizona for the month of June, 43 fewer than June of last year. While the June figure was lower than the previous year, bankruptcies were up slightly in the first half of this year. There were 4,589 bankruptcies filed in the state in the first six months of 2023, while in 2022, there were 4,558, a change of less than one percent. Chapter 13 (individual debt adjustment) bankruptcies increased 4.4% in the first half of the year while Chapter 11 (reorganization), which posted just four fewer than the same period last year, was the only type to decrease. Pinal and Maricopa counties had the largest increases in the number of filings during the first half of the year, and even those were slight, at 16 and 11 more, respectively, while seven counties had the same number or fewer filings than last year. The Yuma office had a decrease of 6.3% in the first half of the year, the Tucson office had an increase of 1.5%, and the Phoenix office (which combines the Phoenix and Prescott areas) had a slight increase of 0.8%.
The monthly Consumer Price Index increased 0.2% in June on a seasonally adjusted basis with shelter being the biggest contributor to price changes for the month. The index for all items less food and energy also rose 0.2%. The annual inflation rate in June was 3.0%, the lowest since March 2021. All items less food and energy was up 4.8% for the year. Prices for energy dropped 16.7% over the year in June, while food posted a 5.7% increase. Inflation for the Phoenix area in June was 4.4%, lower than it has been since early 2021 but still higher than the U.S. city average. Prices in the West region were 3.5% over the same period a year ago, and the narrower Mountain region, which includes Arizona, rose 3.7% over the year in June.
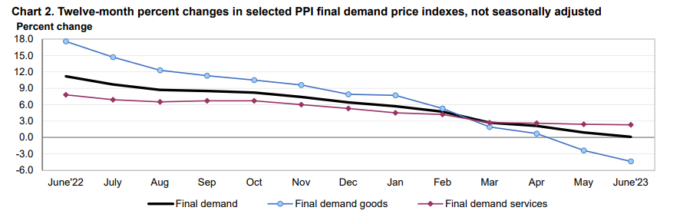
Producer prices barely moved in June, ticking up 0.1% for the month following a decline of 0.4% in May on a seasonally adjusted basis. Final demand services increased 0.2% in June, while final demand goods were unchanged. The 12-month change in final demand was 0.1% in June before seasonal adjustment, down from the peak of 11.7% in March 2022 (it has steadily moved down since June 2022). The 12-month change in final demand less foods, energy, and trade has also steadily trended down, reaching 2.6% compared to 2.8% in May and 3.3% in April.
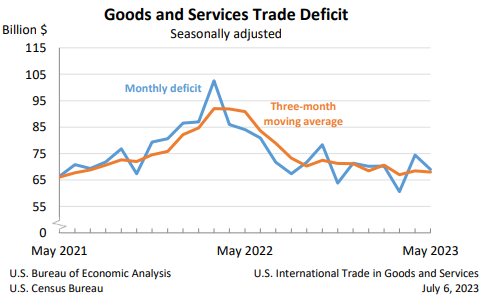
The May U.S. trade deficit came in at $69.0 billion in May, down $5.5 billion from the revised $74.4 billion in April, seasonally adjusted. May exports fell $2.1 billion from April to reach $247.1 billion. Imports similarly declined $7.5 billion to $316.1 billion. The decrease in the deficit reflects a decrease in the goods deficit by $4.8 billion to $91.3 billion and an increase in the services surplus of $0.7 billion to $22.3 billion. Over the year, the deficit has decreased $101.7 billion (22.8%) from the same period 2022. Exports increased $48.0 billion (3.9%), and imports decreased $53.7 (3.2%). China ($24.9), the European Union ($16.5), and Mexico ($13.5) have the largest trade deficits with the U.S., while South and Central America ($4.2), the Netherlands ($3.9), and Belgium ($1.7) have the greatest surpluses (in billions).
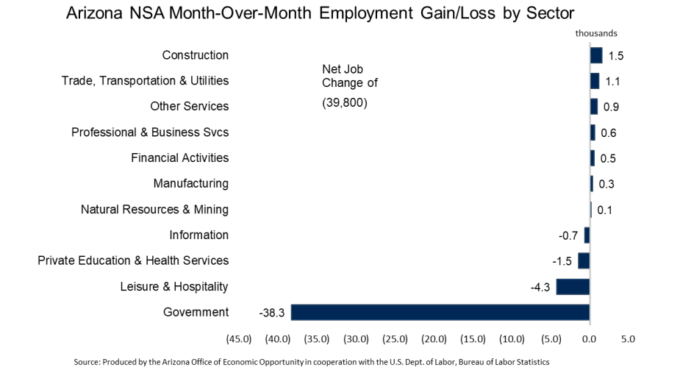
Total nonfarm employment in Arizona increased by 71,900 jobs year-over-year in June, with the seasonally adjusted unemployment rate increasing to 3.5% from 3.4% in May. The US seasonally adjusted unemployment rate decreased to 3.6% in June from 3.7% in May. Arizona non-seasonally adjusted total nonfarm employment decreased by 39,800 jobs over the month, a smaller figure than the pre pandemic average of 51,600 jobs lost in June. Job losses occurred in leisure and hospitality (-4,300) and private education and health services (-1,500). The government sector recorded a loss of 38,300 jobs in June, less than the pre pandemic average of 42,700, with most of the losses occurring in local government education (-31,300). Employment gains were reported in construction (1,500); trade transportation and utilities (1,100); other services (900); professional and business services (600); financial activities (500); manufacturing (300); and natural resources and mining.
Arizona’s June unemployment rate was 3.5%, a 0.3 percentage point decrease from the same time last year. This placed Arizona among the 22 states that experienced a decrease in seasonally adjusted jobless rates from a year earlier. The U.S. unemployment rate was little changed over the month at 3.6% in June and was the same as the June 2022 figure, as reported by the Bureau of Labor Statistics July 21 state employment release. Unemployment rates fell in 11 states and were stable in 39 states and the District of Columbia. New Hampshire and South Dakota tied for the lowest jobless rates in June at 1.8% each, followed by Nebraska and Vermont at 1.9%. Nine states achieved unemployment rates that set record lows: Arkansas at 2.6%, Maryland at 2.0%, Massachusetts at 2.6%, Mississippi at 3.1%, New Hampshire at 1.8%, Ohio at 3.4%, Oklahoma at 2.7%, Pennsylvania at 3.8%, and South Dakota at 1.8%. Nevada had the highest unemployment rate, reaching 5.4%.
The May 2023 release of the Job Openings and Labor Turnover (JOLTS) report stated that job openings in the U.S. decreased to 9.8 million, with a job openings rate of 5.9%. The industries that saw the largest decreases in job openings were in health care, social assistance, and finance and insurance. The industries that saw the largest increase in job openings were educational services, state and local government education, and federal government. Nationally, the number of hires remained relatively stable at 6.2 million, with a rate of 4.0%. Total separations in the nation were 5.9 million, with a separation rate of 3.7%. The number and rate of quits increased, at 4.0 million and 2.6%, respectively. The number of layoffs and discharges remained unchanged at 1.6 million and 1.0%. Other separations in the U.S. were little changed, reporting at 301,000.