

Delaney O’Kray-Murphy, EBRC research economist
Valorie Rice, senior business information specialist
Alexandra Jaeger, EBRC web applications developer
Current data releases as of 11 August 2023
Housing affordability in Arizona and nationally took another hit in the second quarter of 2023 primarily due to rising home prices and higher interest rates based on the latest National Association of Homebuilders/Wells Fargo Housing Opportunity Index released August 10. Nationally, 40.5% of new and existing houses sold in the second quarter were affordable to families earning the U.S. median income of $96,300. This was down from 45.6% in the first quarter, but still better than the fourth quarter of 2022 which was the lowest recorded measure (at 38.1%). Housing affordability was lower in all Arizona metropolitan areas for the second quarter of 2023 after increasing across the board in the first quarter of the year. In descending order, the share of affordable homes in Arizona were 60.8% in Sierra Vista-Douglas, 54.4% in Yuma, 41.7% in Lake Havasu City-Kingman, 38.6% in Tucson, 30.1% in Phoenix, 27.3% in Flagstaff and 23.5% in Prescott Valley-Prescott. House prices increased in nearly all Arizona metropolitan areas in the second quarter, with only Flagstaff and Lake Havasu City-Kingman posting slight decreases.
Phoenix house prices decreased 7.6% over the year in May. Nationally, house prices were 0.5% lower than last May, though posted a monthly increase of 1.2% from April to May, according to the July 25 S&P CoreLogic Case-Shiller Index. All cities in the 20-city composite had monthly price gains; however, 10 out of the 20 experienced annual declines in house prices. Seattle and San Francisco dropped the lowest with decreases of 11.3% and 11.0% over the year, respectively. Chicago, on the other hand, had the largest 12-month change in house prices in May at 4.6%, followed by Cleveland at 3.9% and New York at 3.5%. This was the first time in a long while that a city from the Midwest has held the top spot in house price appreciation, as places like Phoenix, Las Vegas, and Maimi have had the biggest price changes over the last five years.
Arizona was among three states with the largest decrease in the number of total separations in May at -20,000, a rate of 3.9%, according to the July 26 State Job Openings and Labor Turnover (JOLTS) report. Job opening rates decreased in May for 12 states and were little changed in all other states. The job opening rate for Arizona was 6.2%, which was one of the largest decreases across the nation, after posting 7.1% for April and 6.1% for March. Nationally, hire rates and the number of hires were little changed.
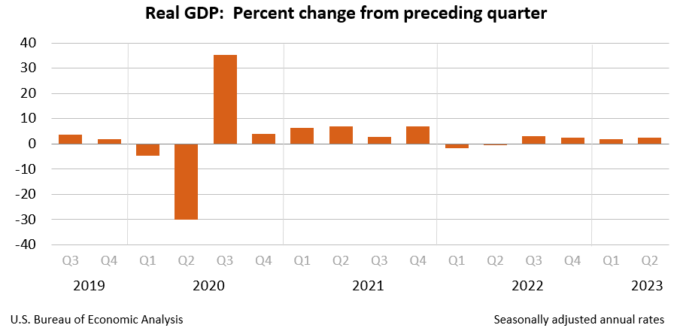
Real gross domestic product (GDP) increased at an annual rate of 2.4% in the second quarter of 2023, according to the advanced estimate July 27th Bureau of Economic Analysis release. The increase in real GDP reflects increases in consumer spending, nonresidential fixed investment, state and local spending, private inventory investment, and federal government spending. These increases were offset by a decrease in exports and residential fixed investment. Imports, which subtract from GDP, also decreased. Current dollar GDP increased by 4.7%, or $305.2 billion, at an annual rate. Both the price index for gross domestic purchases and the PCE price index showed signs of disinflation from last quarter, increasing by 1.9% and 2.6%, respectively, in the second quarter.
In June, over-the-year metropolitan unemployment rates were lower in 222 of 389 areas, higher in 119, and unchanged in the remaining 48. The June unemployment rates for the Tucson and Phoenix metropolitan areas came in at 4.4% and 3.9%, respectively. Yuma had the highest unemployment rate in Arizona at 14.3%, while Phoenix had the lowest. Baltimore-Columbia-Towson, MD; California-Lexington Park, MD; Manchester, NH; Portsmouth, NH-ME; and Sioux Falls, SD, had the lowest unemployment rates in the nation at 1.7%, while El Centro, CA, had the highest rate at 16.9%.
The U.S. unemployment rate remained little changed in July, coming in at 3.5%, while total nonfarm payroll jobs rose by 187,000, according to the July employment situation summary. Job gains occurred in health care (+63,000), social assistance (+24,000), financial activities (+19,000), and wholesale trade (+18,000). Employment dropped in temporary help services (-22,000) and professional and business services (-8,000). In July, average hourly earnings for employees on private nonfarm payrolls rose by 14 cents (0.4%) to $33.74. Over the year, average hourly earnings have risen by 4.4%. The average workweek for private nonfarm employees edged down by 0.1 hours to 34.3 hours. This release also revised the total nonfarm employment gains downward for May and June by 25,000 and 24,000, respectively.
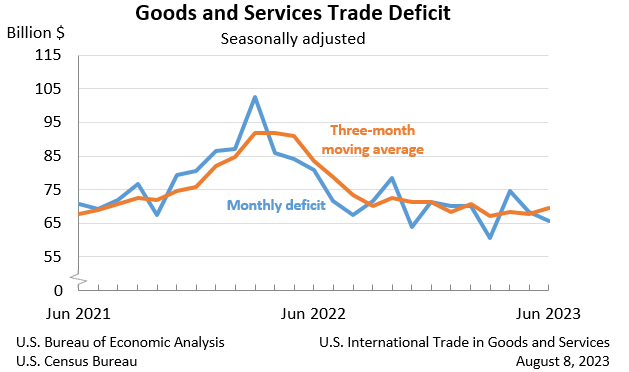
The June U.S. Trade deficit came in at $65.5 in June, down $2.8 billion from the revised $68.3 billion in May, seasonally adjusted. June exports fell $0.3 billion from May to reach $247.5 billion. Imports similarly declined by $3.1 billion to $313.0 billion. The decrease in the goods and services deficit reflects a decrease in the goods deficit by $2.8 billion to $88.2 billion and a similar decrease in the services surplus of less than $0.1 billion to $22.7 billion. Over the year, the goods and services deficit decreased by $177.7 billion, or 22.3%, from June 2022. Exports increased by $37.6 billion (2.5%) and imports decreased by $80.1 billion (4.0%). The Netherlands ($4.6), South and Central America ($4.3), and Hong Kong ($2.6) have the greatest surpluses, while China ($22.8), the European Union ($18.2), and Mexico ($12.9) have the greatest deficits (in billions).
The Consumer Price Index increased 0.2% in July on a seasonally adjusted basis, with shelter being the primary contributor to the rise in prices over the month. The index for all items less food and energy rose 0.2% in July, the same as it had in June. The annual inflation rate was 3.2% in July on an unadjusted basis, a bit higher than the 3.0% for June but far lower than the 8.5% experienced in July 2022. The all items less food and energy index rose 4.7% over the last 12 months while the food index increased 4.9% and the energy index went down 12.5%.
Producer prices rose 0.3% in July on a seasonally adjusted basis. Final demand goods increased 0.1% for the month. Final demand services bumped up 0.5% after decreasing in June. The 12-month change in final demand was 0.8%, a reversal of the downward trend of the last several months. The 12-month change in final demand less foods, energy, and trade was 2.7% in July, the same as it had been in June.


