Delaney O’Kray-Murphy, EBRC research economist
Valorie Rice, senior business information specialist
Alexandra Jaeger, EBRC web applications developer
Prarthana Magon, Undergraduate Research Assistant
Current data releases as of 22 September 2023
The poverty rate for those aged 65 and over increased in Arizona between 2021 and 2022 based on the 2022 American Community Survey (ACS) one-year estimates released September 14. The poverty rate for those aged 65 and over did not decrease in any state, though there were 19 states with a statistically significant increase in poverty for older people. Arizona was one of those states, as the rate moved from 9.6% in 2021 to 10.4% in 2022. Montana had the largest increase at a 3.7 percentage point difference. While the poverty rate in Arizona increased over the year for the older population, it decreased for children. Arizona was one of 11 states with a decline in the poverty rate for those under the age of 18, moving down 1.5 percentage points to 15.8% in 2022. Arizona was also one of the states that experienced a decrease in the percentage of households that received Supplemental Nutritional Assistance Program (SNAP) benefits in 2022.
Arizona was among four states with the largest decrease in the total separations rates with -1.0 percentage points for July, according to the September 19th State Job Openings and Labor Turnover (JOLTS) report. Job openings rates decreased in July for nine states, increased in three states, and were little changed in all other states. The job openings rates for Arizona were 5.7% for July, 5.5% for June, and 6.0% for May. Arizona was one of two states with a decrease in the number of layoffs and discharges with -21,000. The number of layoffs and discharges increased in four states and was little changed in the remaining 44 states. Nationally, the number of job openings slightly decreased, and the layoffs and discharges rates were little changed.
The August Consumer Price Index for All Urban Consumers (CPI-U) experienced a notable increase of 0.6%, following a modest 0.2% rise in July, as reported by the U.S. Bureau of Labor Statistics. The primary catalyst for this monthly increase was gasoline, which single-handedly contributed to more than half of the overall increase. The energy sector saw a notable 5.6% increase, with all major components contributing. Furthermore, shelter contributed to the monthly increase as well, with the shelter index rising for the 40th consecutive month. The food sector experienced a modest 0.2% rise, as both the food at home and food away from home indices showed slight increases of 0.2% and 0.3%, respectively. On an annual basis, inflation was 3.7% in August, up slightly from the 3.2% in July. The all-items index, excluding food and energy, saw a significant 4.3% increase over the same period. Energy prices decreased by 3.6% in the 12 months ending in August, while the food index increased by 4.3% over the past year. The Phoenix MSA had an annual increase of 3.7% in August, matching that of the U.S., and down from 4.4% in June.
Use your cursor as a tooltip to switch series ON/OFF at the bottom of the chart. Run your cursor over the chart to view values.
In August 2023, the Producer Price Index showed a notable 0.7% increase on a seasonally adjusted basis, as reported by the U.S. Bureau of Labor Statistics. This surge followed a 0.4% increase in July, marking the most significant uptick in final demand prices since a 0.9% increase observed in June 2022. When considering the unadjusted figures, the index for final demand exhibited a 1.6% increase over the 12 months leading up to August. This increase was primarily driven by rising energy prices, as the index for final demand energy surged by 10.5%. Over 60% of this rise in the index for final demand goods can be attributed to prices for gasoline, which increased by 20.0%. Prices for final demand services rose by 0.2% in August after a 0.5% increase in July. A 1.1% increase in the index for residential real estate services contributed to this rise. Additionally, prices for vegetables, electric power, and industrial chemicals decreased.
The July goods and services trade deficit came in at $65.0 billion, up $1.3 billion from a revised $63.7 billion in June. July exports rose $3.9 billion from June to reach $251.7 billion. July imports similarly rose $5.2 billion to reach $316.7 billion. The increase in the deficit reflects an increase in the goods deficit of $2.0 billion to $90.0 billion and an increase in the services surplus of $0.7 billion to $25.0 billion. Over the year, the goods and services deficit decreased $128.3 billion, or 21.4%, from last July. Exports increased by $27.3 billion (1.6%), and imports decreased by $101.0 billion (4.3%). The Netherlands ($4.5), South and Central America ($4.1), and Hong Kong ($1.5) have the greatest surpluses, while China ($24.0), the European Union ($17.3), and Mexico ($12.8) have the greatest deficits (in billions).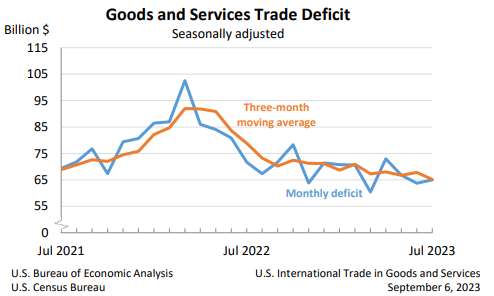
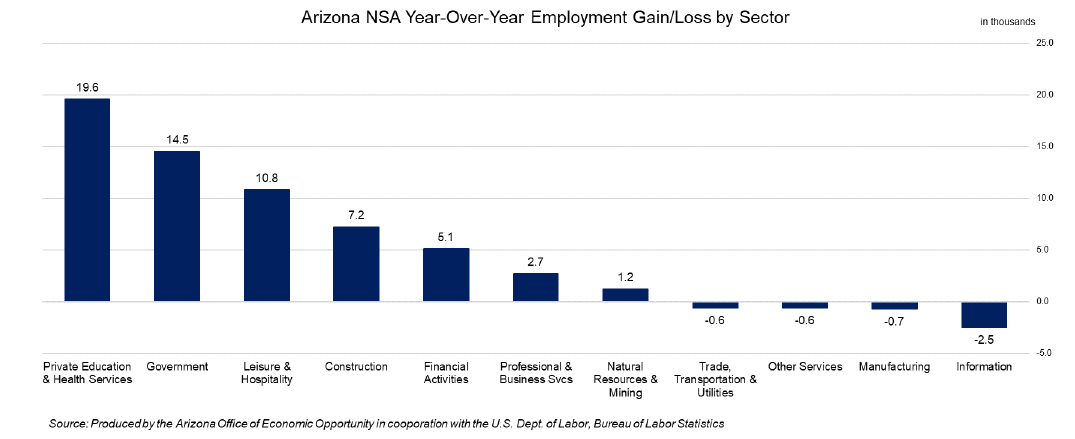
Total nonfarm employment in Arizona increased by 56,700 jobs over the year in August, non-seasonally adjusted, with the seasonally adjusted unemployment rate increasing to 3.8% from 3.6% in July. The U.S. seasonally adjusted unemployment rate similarly rose to 3.8% from 3.5% in July. Arizona’s non-seasonally adjusted total nonfarm employment increased by 49,700 in July, slightly losing to the pre-pandemic average of 54,000 jobs. Employment gains were reported in Government (31,700), Private Education and Health Services (8,800), Professional and Business Services (6,000), Construction (3,900), and Financial Activities (2,500). Job losses occurred in Trade, Transportation & Utilities (-1,200); Manufacturing (-800); Leisure and Hospitality (-700); Other Services (-300); and Information (-200).
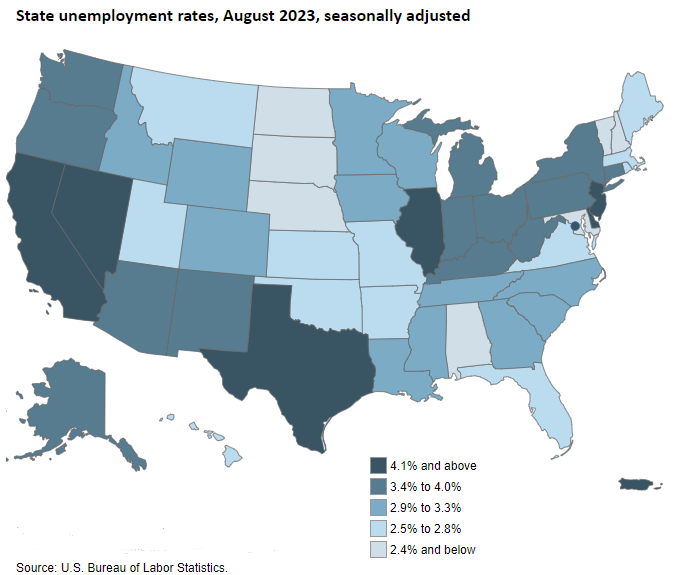
Arizona was one of 10 states with an increase in the unemployment rate for August, moving up 0.2 percentage points to 3.8% on a seasonally adjusted basis. Unemployment rates were stable in most states for the month while two states experienced lower unemployment rates according to the U.S. Bureau of Labor Statistics September 19 State Employment and Unemployment release. The U.S. unemployment rate was 3.8% in August. The lowest jobless rate for the month was in Maryland at 1.7%, while the highest was in Nevada at 5.4%. Maryland (1.7%), Louisiana (3.3%), and North Dakota (1.9%) all posted new series lows for their state.