

Third Quarter 2023 Forecast Update
By George W. Hammond, Ph.D., Director and Research Professor, EBRC
August 2023
The Arizona economy continued to churn out solid gains through the first half of 2023. Jobs, wages, and sales all increased, although at a somewhat slower pace than earlier in the pandemic recovery, and the unemployment rate remained very low. Arizona jobs were essentially back on their pre-pandemic trend, if we take that trend to be EBRC forecasts generated just before the pandemic began. Phoenix inflation, although it remained above the nation, decelerated significantly, thanks to slower gains in house prices and outright price declines in commodities. Housing affordability, however, has dropped precipitously from pre-pandemic levels.
The outlook calls for the U.S. economy to achieve a “soft landing” and avoid recession this year and next. That sets the stage for continued solid gains in Arizona, Phoenix, and Tucson. In addition, the state is expected to far outpace national growth during the next 30 years, with Phoenix leading the way. Even so, state growth is forecast to decelerate significantly compared to average growth rates during the prior 30 years (1992-2022).
Arizona Recent Developments
Jobs in Arizona and Phoenix were back on their pre-pandemic trend in 2023, at least if we take that trend to be EBRC forecasts generated in January 2020. Keep in mind that those forecasts were already calling for state economic growth to decelerate significantly in coming years, driven by the aging of the baby boom generation. In contrast, Tucson jobs remained far below their pre-pandemic trend, primarily due to sub-par performance in private education and health services and professional and business services.
Inflation, measured by the all-items Consumer Price Index for All Urban Consumers (CPIU), in the Phoenix MSA decelerated in June to 4.4% over the year. That was down from a peak of 13.0% in August 2022 but still above the nation at 3.0% (Exhibit 1). The national rate peaked at 9.1% in June 2022.
Exhibit 1: Phoenix MSA and U.S. Inflation Rates, All-Items CPIU, Over the Year, Percent
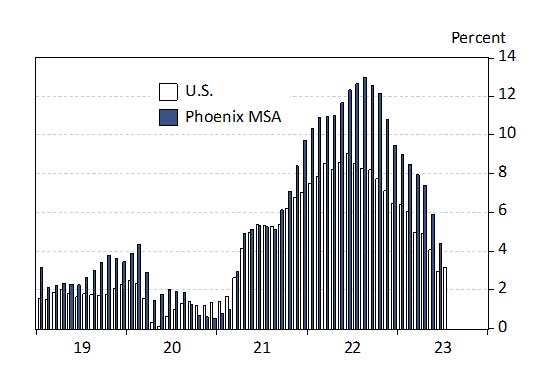
Keep in mind that the all-items inflation rate is a weighted average of price changes for goods and services purchased by U.S. urban residents. It includes sales and excise taxes. The importance of a given good or service in a price index is determined by its share of an average household’s budget.
Part of the reason that all-items inflation has come down recently is because commodity inflation has softened significantly. A more important driver of the deceleration in Phoenix inflation has been the services CPIU, which rose 8.0% over the year in June. That was down significantly from its peak in August 2022 of 13.3%.
What is driving down services inflation? Shelter. Within the services CPIU, housing is by far the largest component and within housing shelter is the largest sector. Shelter includes both rent and imputed owner-occupied rent, as well as temporary shelter like hotel rooms. Owner-occupied rent is a concept estimated by the U.S. Bureau of Labor Statistics (which publishes the CPIU) to put the costs of home ownership on the same basis as rent.
In Phoenix, shelter inflation peaked at 19.5% in September 2022. In June it was down to 12.1%. That was still well above the U.S. at 7.8%. The recent deceleration in Phoenix shelter inflation reflects declining median home prices and slower gains in rent.
Single-family housing affordability across Arizona’s metropolitan areas fell in the second quarter of 2023 after improving modestly to start the year. According to data from NABH-Wells Fargo, the share of homes sold in the Phoenix MSA in the second quarter of 2023 that were affordable to a family making the median income was 30.1%. That was down from 34.3% in the first quarter but up from 18.3% in the last quarter of 2022.
Tucson MSA housing affordability also declined in the second quarter of 2023, falling from 46.8% in the first quarter to 38.6% in the second. Both quarters were above the recent low in Tucson of 35.0% in the last quarter of 2022. Similarly, U.S. housing affordability dropped in the second quarter to 40.5%, down from 45.6% in the first quarter but just above 38.1% in the fourth quarter of last year.
Affordability in Phoenix, Tucson, and the U.S. improved a bit during the first half of 2023 because house prices and interest rates stabilized while the estimate of median family income for 2023 (from U.S. Housing and Urban Development) increased.
As Exhibit 2 shows, housing affordability across Arizona metropolitan areas remained far below pre-pandemic levels in the second quarter. Phoenix MSA housing affordability in the second quarter, at 30.1%, was far below its pre-pandemic level of 64.9%, a decline of 34.8 percentage points. For the Tucson MSA, housing affordability dropped by 32.6 percentage points, from 71.2% to 38.6%. Affordability in the Prescott MSA dropped by 32.4 percentage points during the period, reaching 23.5% in the second quarter. Nationally, housing affordability declined by 22.7 percentage points from the fourth quarter of 2019 to the second quarter of 2023. We see similar trends for the remaining Arizona metropolitan areas.
Exhibit 2: Arizona Housing Affordability by Metropolitan Area, Percent
While housing affordability in Arizona has lost ground to many western metropolitan areas, it remained very competitive compared to the large metropolitan areas in California. In the second quarter, housing affordability in San Diego (6.3%), Los Angeles (3.2%), San Francisco (7.0%), and San Jose (9.0%) was much lower than in Arizona’s metropolitan areas.
As housing affordability has plummeted, and mortgage interest rates more than doubled, housing permits in Arizona tumbled during the second half of 2022 and early 2023. The decline was particularly notable in single-family activity. In better news, single-family permits firmed during the second quarter, although still down over the year.
Overall, Arizona seasonally-adjusted permits through July 2023 were down 16.8% from the same period of 2022 (revised, benchmarked data). Single-family permits accounted for the bulk of the drop (down 25.4%). Multi-family permits were up 0.8%.
In Phoenix, total permits dropped 13.8%, with single-family permits down 25.0% while multi-family permits were up 5.5%.
Tucson housing permits fell 19.4%, with single and multi-family permits down 15.4% and 27.3%, respectively.
Arizona Short-Run Outlook
The forecasts for Arizona, Phoenix, and Tucson depend on the outlook for the global and national economies. After increasing by 2.1% in 2022, the baseline forecast calls for U.S. real GDP growth to slow to 1.8% in 2023 and 1.2% in 2024. The U.S. economy is projected to be stronger in 2023 than last month, reflecting more robust underlying data released recently. Gains are expected to be slightly softer during 2024-2026. On a quarterly basis, the forecast calls for real GDP to increase through 2033 (no recession).
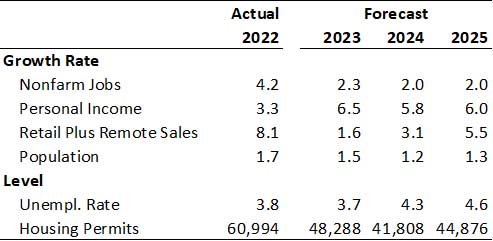
A slowing national economy means slower economic growth in Arizona, Phoenix, and Tucson in the near term. Exhibit 3 summarizes the state outlook for jobs, income, taxable sales, population, unemployment, and housing permits.
Arizona job growth is forecast to decelerate from 4.2% in 2022 to 2.3% in 2023 and again to 2.0% in 2024-2025. Even with this deceleration, the forecast calls for Arizona to match the U.S. this year and far outpace it in 2024 and 2025. Slowing job growth implies a modest increase in the unemployment rate in the near term.
Population growth decelerates in 2023 to 1.5%, down from 1.7% in 2022. This reflects reduced net migration, which is expected to soften as the one-time boost from the pandemic dissipates and as greatly reduced housing affordability (and significantly higher interest rates) reduces mobility. Natural increase rebounds after the pandemic, but that improvement is short lived.
Exhibit 3: Arizona Outlook Summary
Arizona Long-Run Outlook
Over the next 30 years, Arizona’s prospects are bright. The state is forecast to far outpace the nation across the major macroeconomic indicators: jobs, population, and income. However, growth is also expected to slow markedly from the pace of the prior 30 years.
Arizona job growth is projected to average 1.2% per year from 2023-2053. That is quadruple the expected national rate of 0.3% per year. Even so, that is one-half of Arizona’s average annual job growth during the 1992-2022 period.
The story is similar for population growth, with Arizona population projected to reach 10.2 million by 2053. That is an increase of 2.7 million from 2023 and translates into 1.0% per year annual growth. That would be more than double the expected national rate of 0.4% per year. It would also be less than one-half of the state’s average growth rate during the prior 30 years (2.1% per year).
Slowing population growth over the long term is driven by demographic change, as rising deaths outpace the slow pace of births. This transforms natural increase from its historical role of a tailwind to state population growth into a modest headwind by the 2040s.
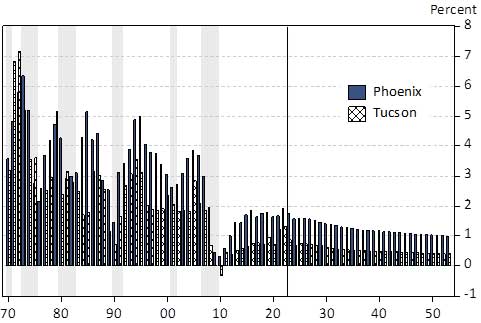
As Exhibit 4 shows, Phoenix population growth is expected to far outpace Tucson, which continues to grow at a solid pace. Tucson population is forecast to reach 1.3 million by 2053, an increase of 182,000. That translates into an average annual growth rate of 0.5% per year, faster than the nation, but well below its average growth rate during the prior 30 years of 1.4% per year.
Exhibit 4: Phoenix and Tucson Population Growth, Annual Data
Risks to the Outlook
The baseline U.S. forecast from S&P Global assumes no U.S. recession this year or next. The baseline forecast is assigned a 55% probability. The pessimistic scenario is assigned 25% and the optimistic scenario is assigned the remaining 20%.
The pessimistic scenario assumes a national downturn in the second half of 2023, driven by tightening lending standards by banks, which restrict consumer and business spending, as well as continued problems arising from the Russian invasion of Ukraine. This generates modest over-the-year job losses in Arizona in early 2024. The optimistic scenario assumes gains faster than expected under the baseline.
In the long run, Arizona’s growth will be significantly influenced by innovation (productivity growth), private physical capital investment, public capital investment, and possible resource constraints (primarily water).
Innovation is a key driver of long-run economic growth. In turn, innovation is significantly influenced by human capital development, including education and health. In particular, states and local areas with higher rates of educational attainment tend to generate stronger economic performance than areas with lower attainment. Investment in the state’s workforce, as well as overall improvement in educational attainment, will be key to fostering continued strong growth during the next 30 years.
Arizona also needs to maintain a competitive tax and regulatory climate, in order to ensure that appropriate private physical capital investment (machinery and residential and nonresidential structures) in the state is not discouraged. This includes measures to ease residential construction to maintain housing affordability.
It is also important for the state to undertake key infrastructure investments to support growth. These will include investments in highways and roads, water and sewer infrastructure, air transportation, telecommunications, and border ports.
Natural resource availability will also matter, particularly for water. With impending large cuts to the state’s Colorado River allocation, drought, and climate change, there is growing pressure to change current water use practices. Restricted water availability and/or rising water costs would raise the cost of living and doing business in the state, with possible negative impacts on growth.
VIEW MOST RECENT FORECAST DATA FOR ARIZONA, PHOENIX, AND TUCSON
If your business or organization requires more timely and in-depth forecast data and analysis, find out about the benefits of joining EBRC’s Forecasting Project and email EBRC director George Hammond at ghammond@arizona.edu(link sends e-mail).
Copyright 2023 Economic and Business Research Center, The University of Arizona, all rights reserved.


