Delaney O’Kray-Murphy, EBRC research economist
Valorie Rice, senior business information specialist
Prarthana Magon, EBRC student researcher
Alexandra Jaeger, EBRC web applications developer
Current data releases as of 9 November 2023
Housing affordability in the United States sank to its lowest level in index history in the third quarter of 2023. This applied for two Arizona metropolitan areas as well. The fourth quarter of 2022 was the low point for affordability in most Arizona metropolitan areas; however, Lake Havasu City-Kingman and Tucson both experienced even lower affordability in the third quarter of 2023. The share of homes sold in the third quarter that were affordable to families earning the median income for those areas were: 56.9% in Sierra Vista-Douglas, 42.9% in Yuma, 37.5% in Lake Havasu City-Kingman, 33.8% in Tucson, 27.5% in Flagstaff, 24.9% in Phoenix, and 20.9% in Prescott Valley-Prescott. Only three Arizona metro areas (Sierra Vista, Yuma, and Lake Havasu) had higher affordability than the nation, and all three were among the top 12 areas for affordability within the West region. The National Association of Home Builders (NAHB)/Wells Fargo Housing Opportunity Index indicated only 37.4% of new and existing homes sold in the third quarter were affordable to families earning the U.S. median income. NAHB pointed to rising interest rates as the primary factor for decreased affordability.
U.S. house prices rose 2.6% over the year in August, up from 1.0% in July based on the S&P CoreLogic Case-Shiller Indices October 31 release. Phoenix and Las Vegas both improved over last month, but are still at the bottom of the 20 city-composite when it comes to year-over-year price changes at -3.9% and -4.9%, respectively. They were among seven cities with lower prices over the year in August, all of which were located in the West or Southwest. Chicago had the highest price gain over the year for the fourth month in a row at 5.0%, followed by New York (5.0%) and Detroit (4.8%).
During the third quarter of 2023, Phoenix saw a 3.5% increase in the Employment Cost Index (ECI) for private industry workers, indicating a slower rate of compensation growth compared to the previous quarter’s 3.9% increase. In this same period, the national average for total compensation growth stood at 4.3%, positioning Phoenix’s ECI slightly below the U.S. average. When compared with other major metropolitan areas, Phoenix’s ECI increase appeared comparatively moderate. For example, metros such as Miami-Fort Lauderdale-Port St. Lucie, Philadelphia-Reading-Camden, and Washington-Baltimore-Arlington showed significantly higher compensation growth rates of 5.2%. New York-Newark and Los Angeles maintained growth in line with the national trend, registering ECI values of 4.7% and 4.6%, respectively. In contrast, metros like San Jose-San Francisco-Oakland and Dallas-Fort Worth demonstrated more restrained compensation growth, similar to Phoenix, with ECI figures of 3.3% and 3.6%, respectively.
The September 2023 release of the Job Openings and Labor Turnover (JOLTS) report stated that the number of job openings in the U.S. changed little at 9.6 million, while the job openings rate was unchanged at 5.7%. The industries that saw the largest increase in job openings were accommodation and food services and in arts, entertainment, and recreation. The industries that saw the largest decrease were other services, federal government, and information. Nationally, the number of hires changed little at 5.9 million, with a rate of 3.7% for the third month in a row. Total separations in the nation were little changed at 5.5 million, with a rate of 3.5%. The number of quits changed little at 3.7 million with a rate of 2.3%. respectively. The number of layoffs and discharges changed little at 1.5 million and 1.0%. The number of other separations posted for the U.S. were 352,000.
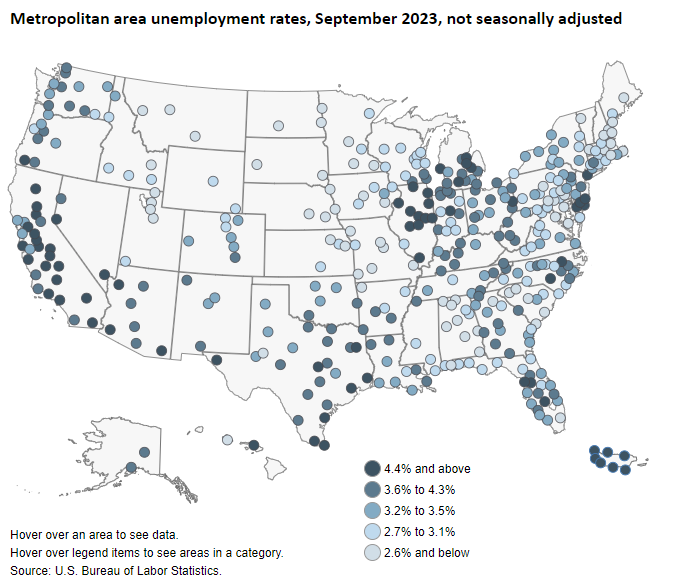
Arizona metropolitan areas were among those that experienced higher unemployment rates this September compared to last year. Flagstaff was unchanged while all other areas in Arizona increased, with Yuma posting a 1.8 percentage point change over the year. Unemployment rates increased over the year in 231 of 389 metropolitan areas, decreased in 131 and were unchanged in 27 for September. The U.S. Bureau of Labor Statistics release indicated that Bismark, ND and Fargo, ND-MN had the lowest unemployment in the nation for September at 1.4% each, while El Centro, CA had the highest at 21.1%. September unemployment rates in Arizona metro areas were: 4.2% in Flagstaff, 4.7% in Lake Havasu City-Kingman, 3.8% in Phoenix, 3.8% in Prescott, 4.8% in Sierra Vista-Douglas, 4.2% in Tucson, and 14.8% in Yuma.
The U.S. unemployment rate came in little changed in October at 3.9%, while total nonfarm payroll jobs rose by 150,000, according to the October employment situation summary. Job gains occurred in health care (58,000), government (51,000), and social assistance (19,000). Employment dropped in manufacturing (-35,000) and motion picture and sound recording (-5,000) in part due to the strikes in both sectors. In October, average hourly earnings for employees on private nonfarm payrolls rose by 7 cents (0.2%) to $34.00. Over the year, average hourly earnings have increased by 4.1%. The average workweek for private nonfarm employees edged down by 0.1 hours to 34.3 hours. This release also revised down the total nonfarm employment gains in August by 62,000 and in September by 39,000.
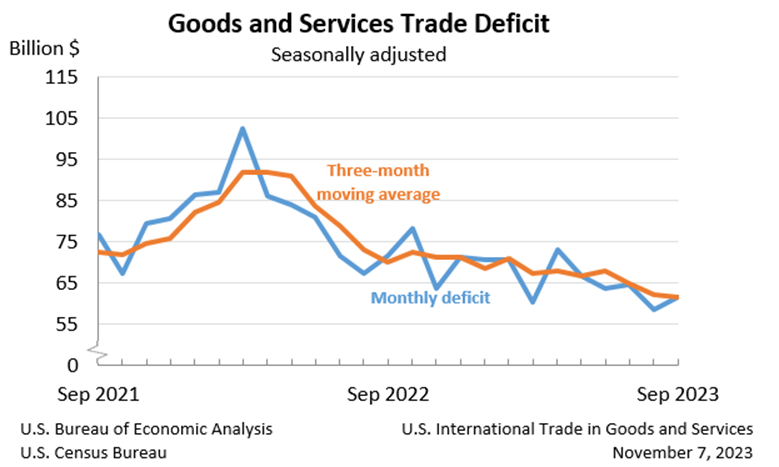
The September goods and services trade deficit landed at $61.5 billion, up $2.9 billion from a revised $58.7 billion in August. September exports rose $5.7 billion from August to reach $261.1 billion. September imports similarly rose $8.6 billion to reach $322.7 billion. The increase in the deficit reflects an increase in the goods deficit of $1.7 billion to $86.3 billion and a decrease in the services surplus of $1.2 billion to $24.8 billion. Over the year, the goods and services deficit decreased $147.4 billion, or 20.0%, with exports increasing $22.7 billion, or 1.0%, and imports decreasing $124.8 billion, or 4.2%. South and Central America ($4.8), Netherlands ($3.2), and Hong Kong ($2.7) have the greatest surpluses, while China ($24.1), the European Union ($16.8) and Mexico ($12.2) have the greatest deficits (in billions).