George W. Hammond, EBRC director and Eller research professor
Arizona’s unemployment rate ticked up to 4.2%
Arizona lost 1,200 seasonally-adjusted jobs over the month in October, its first monthly drop since July. The state added a revised 4,700 jobs in September, down from the preliminary estimate of 8,200.
Over the month in October, professional and business services dropped 3,200 jobs, followed by financial activities (down 2,600), leisure and hospitality (down 2,000), other services (down 800), manufacturing (down 300), information (down 300), and construction (down 100).
Partially offsetting those declines were gains in private education and health services (up 4,400), trade, transportation, and utilities (up 2,500), government (up 1,100), and natural resources and mining (up 100).
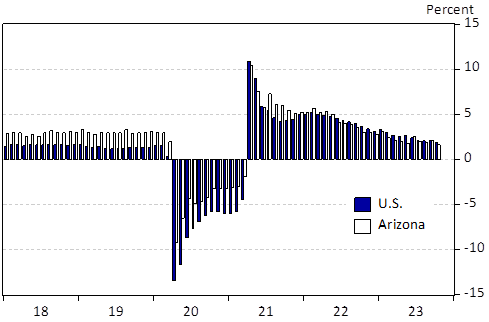
Over the year, Arizona jobs were up 51,100, which translated into a 1.6% increase (Exhibit 1). That was below the U.S. pace of 1.9%. Phoenix MSA jobs were up 1.7% in October and Tucson jobs were up 1.1%.
Exhibit 1: Arizona and U.S. Over-the-Year Job Growth, Nonseasonally Adjusted, Percent
Exhibit 2 shows how Arizona’s over-the-year growth was distributed across industries (with data on 2022 annual wages). Private education and health services jobs were up from most from October 2022 to October 2023, followed by government, leisure and hospitality, construction, and trade, transportation, and utilities.
Those gains were partially offset by losses in other services, information, and manufacturing.
Exhibit 2: Arizona Net Job Change and 2022 Annual Wages per Worker
Arizona’s seasonally-adjusted unemployment rate ticked up to 4.2% in October, up from 4.0% in September and up from 3.4% in April and May. The state rate was modestly above the U.S. at 3.9%.
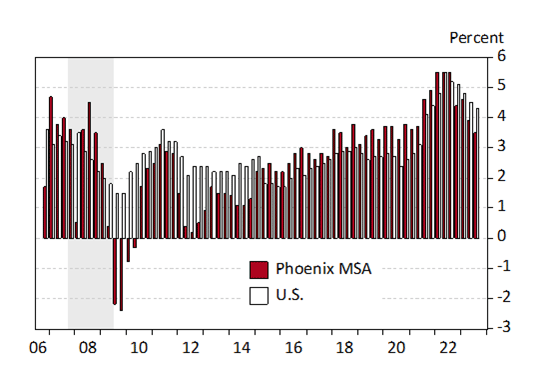
The state unemployment rate suggests a modest loosening in the labor market. Additional evidence of a softening labor market comes from the employment cost index. Exhibit 3 shows growth in private-sector total compensation for Phoenix and the U.S. Total compensation includes wages and salaries as well as fringe benefits. This index is adjusted for employment shifts across industries and occupations.
Exhibit 3: Phoenix and U.S. Employment Cost Growth, Over-the-Year Percent Change
Phoenix employment costs rose by 3.5% over the year in the third quarter of 2023, down from recent peaks at 5.5% and below the national pace of 4.3%. Phoenix employment cost growth has been below the national average for the past year and is now back to pre-pandemic levels.


