

Delaney O’Kray-Murphy, EBRC research economist
Alexandra Jaeger, EBRC web applications developer
Prarthana Magon, EBRC student researcher
Valorie Rice, senior business information specialist
Current data releases as of 22 November 2023
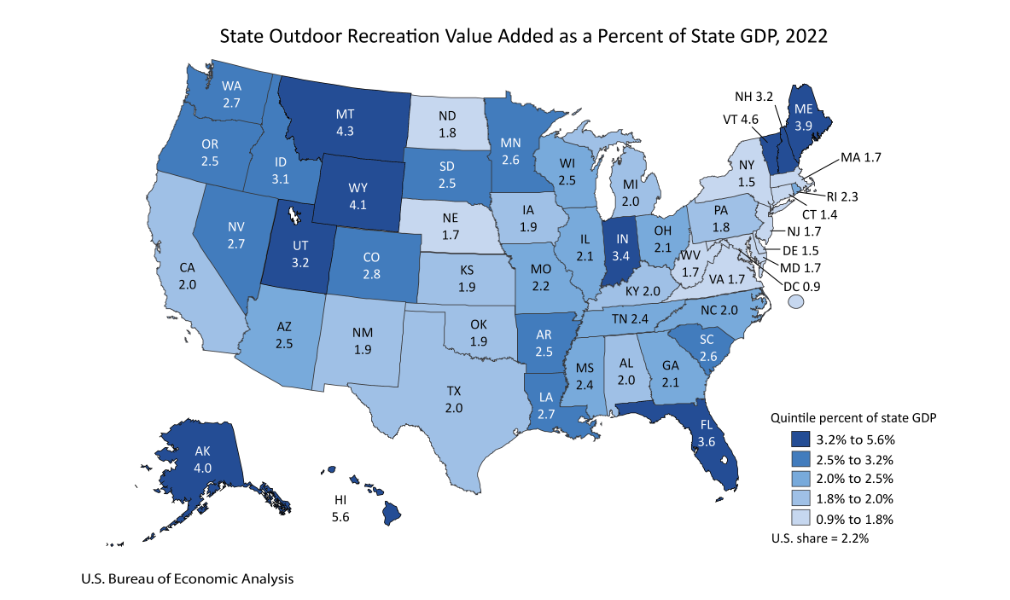
The value added from the outdoor recreation economy accounted for 2.5% of Arizona’s state GDP in 2022. Value added for outdoor recreation as a share of state GDP ranged from 1.4% in Connecticut to 5.6% in Hawaii. The top five states were Hawaii (5.6%), Vermont (4.6%), Montana (4.3%), Wyoming (4.1%), and Alaska (4.0%). Arizona’s 2.5% placed it in the second quintile. The share nationally was 2.2%. Outdoor recreation grew at a faster pace than the overall U.S. economy in 2022 based on the U.S. Bureau of Economic Analysis annual report measuring the outdoor recreation economy. Outdoor recreation employment increased by 7.4% nationally and ranged from 1.1% in Kansas to 18.5% in Hawaii. Arizona had an increase of 5.8% in outdoor recreation employment for 2022.
The October Consumer Price Index for All Urban Consumers (CPI-U) remained steady, showing no change from September’s 0.4% increase. The stability was influenced by a rise in the shelter index, compensating for a decline in the gasoline index. The energy index decreased by 2.5% over the month, primarily due to a significant drop in gasoline prices, while the food index increased by 0.3% in the same period. Excluding food and energy, the index rose by 0.2% in October, slightly lower than the 0.3% increase in September. Over the 12 months ending in October, all items index increased by 3.2%, a smaller rise compared to the 3.7% increase in the 12 months ending in September. The all items less food and energy index rose by 4.0% over the last 12 months, marking its smallest change since September 2021. The energy index decreased by 4.5% over the 12 months ending in October, while the food index increased by 3.3% during the same period.
Use your cursor as a tooltip to switch series ON/OFF at the bottom of the chart. Run your cursor over the chart to view values.
In October, the U.S. Bureau of Labor Statistics reported a 0.5% decline in the Producer Price Index (PPI) for final demand, the largest drop since April 2020. The decline was driven by a 1.4% drop in the index for final demand goods, primarily influenced by a 6.5% decrease in energy prices. Prices for final demand services remained unchanged. Notably, over 80% of the decline in final demand goods was attributed to a 15.3% drop in gasoline prices. Final demand services saw a 3.1% increase in airline passenger services but remained unchanged overall. The unadjusted index for final demand increased by 1.3% over the 12 months ending in October. The index for final demand, excluding foods, energy, and trade services, rose by 0.1% in October, marking a 2.9% increase over the 12 months ending in October.
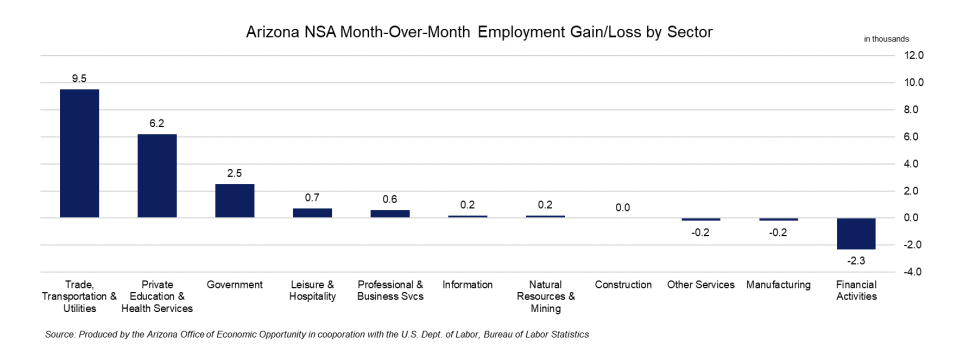
Total nonfarm employment in Arizona increased by 51,100 jobs over the year in October, with the seasonally- adjusted unemployment rate rising 0.2 percentage points to 4.2%. The U.S. seasonally- adjusted unemployment rate increased slightly in October, gaining 0.1 percentage points to 3.9%. Arizona non-seasonally adjusted total nonfarm employment increased by 17,200 jobs in October, lower than the pre-pandemic average of 27,800. Employment gains were reported in trade, transportation, and utilities (9,500), private education and health services (6,200), government (2,500), leisure and hospitality (700), professional and business services (600), information (200), and natural resources and mining (200). Employment losses occurred in financial activities (-2,300), other services (-200), and manufacturing (-200). Private education and health services (24,100) saw the greatest over-the-year employment increase, while other services (-3,600) saw the greatest decrease.
In October, over-the-month state unemployment rates were higher in 26 states and stable in the remaining 24 and the District of Columbia. Arizona showed a 0.2 percentage point increase in unemployment to 4.2%, seasonally adjusted. Maryland had the lowest jobless rate in October at 1.7%, followed by North Dakota at 1.9%. On the other hand, Nevada had the highest unemployment rate of 5.4%. Over the year, 21 states had unemployment rate decreases, while 12 states and the District of Columbia reported rate increases. Arizona did not have a significant over-the-year unemployment rate change but showed a 1.8% increase in jobs.
Per capita personal income (PCPI) increased for most Arizona counties in 2022 based on the November 16 U.S. Bureau of Economic Analysis annual Personal Income by County and Metropolitan Area report. Per capita personal income ranged from $40,981 in Graham County to $63,461 in Maricopa County in 2022. Greenlee County had the largest boost in PCPI for the year, increasing 12.5% while Apache County had a decline of -0.4%. Nationally, the PCPI of $65,470 in 2022 was an increase of 1.6%, down from an increase of 8.9% in 2021. Overall, metropolitan counties rose by 1.7% while nonmetropolitan counties had a smaller increase at 1.2% in 2022 compared to 8.9% across the board in 2021.
According to the November 20th State Job Openings and Labor Turnover (JOLTS) report, job openings rates increased in September for one state, decreased in three states, and were little changed in all other states. The job openings rates for Arizona were 5.9% for September, 5.7% for August, and 5.9% for July. The number of job openings increased in one state, decreased in four states, and was little changed in the remaining 45 states. Arizona was little changed with +6,000. Hire rates increased in one state, decreased in one state, and little changed in all other states. The hire rates for Arizona were 4.1% for September, 4.1% for August, and 4.0% for July. Arizona was one of five states that had a decrease in the number of layoffs and discharges at -12,000. The largest decrease was seen in Illinois with -53,000. All other states were little changed. Nationally, the job openings, hires, and total separations rates were little changed.
The average weekly wage for Arizona’s two largest counties increased more than the nation for the second quarter of 2023. Nationally, wages increased 3.2% over the year in the second quarter while in Maricopa County they increased 3.5% and in Pima County 4.8%. The change in employment from June 2022 to June 2023 was split, with Maricopa posting a higher percentage than the nation at a 2.6% increase for the county compared to 2.4% for the nation while Pima was lower than both with a 1.9% increase. The Quarterly Census of Employment and Wages (QCEW) released by the U.S. Bureau of Labor Statistics indicated that employment increased for most of the largest counties in the nation from June 2022 to June 2023 with Midland, TX increasing 7.0%. Clayton, GA experienced the largest over-the-year gain in average weekly wages for the second quarter of 2023 at 17.2%.


