

EBRC Research Staff
Current data releases as of 08 December 2023
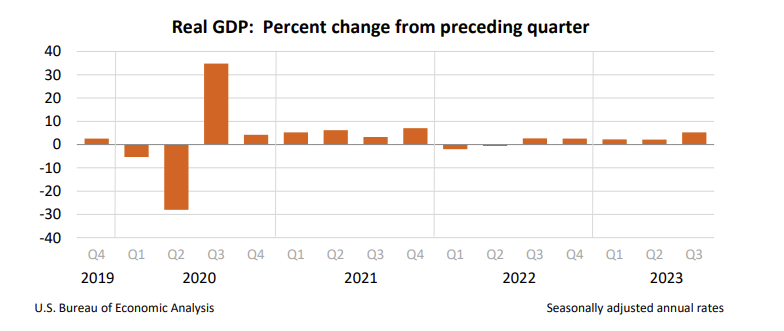
Real gross domestic product (GDP) increased at an annual rate of 5.2% in the third quarter of 2023, a 0.3 percentage point increase from the preliminary estimate, according to the secondary estimate released by the Bureau of Economic Analysis. The increase in real GDP reflects upward revisions to nonresidential fixed investment and state and local government spending that were offset by a downward revision to consumer spending. Imports, a subtraction to GDP, were also revised down. Compared to the previous quarter, the acceleration of real GDP reflects increases in consumer spending and private inventory investment, an upturn in both exports and imports, and a deceleration in nonresidential fixed investment. Current-dollar personal income, disposable personal income, and personal saving were all revised upwards from the previous estimate. The first estimate for real gross domestic income, an alternative measure to GDP, was released at 1.5%, the average of Real GDP and Real GDP was 3.3%. –Delaney O’Kray-Murphy
[Note the third estimate for U.S. GDP will be released shortly after this article is published.]
Real GDP by state increased 1.5% in Arizona in the second quarter 2023, below the U.S. change of 2.1% for the same period. The percent change for states ranged from -1.9% in Vermont to 8.7% in Wyoming during the second quarter. Utilities increased in all 50 states and the District of Columbia and was the leading contributor to growth in 22 states, including Arizona. –Valorie Rice
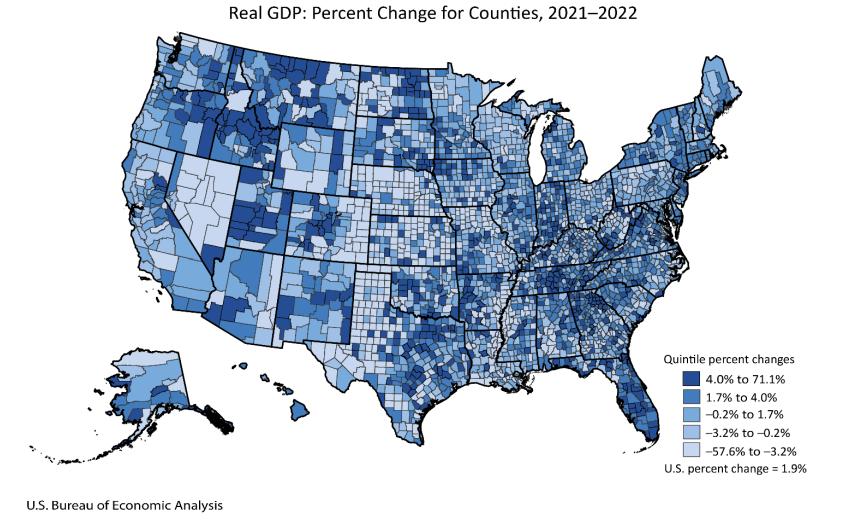
After increasing substantially in 2021, real GDP decreased in half of Arizona’s counties in 2022 based on the recent U.S. Bureau of Economic Analysis’ Gross Domestic Product by County and Metropolitan Area 2022 release. Arizona counties that continued to see a boost in real GDP for 2022 were Yuma (6.2%), Maricopa (4.1%), Coconino (2.8%), Pima (1.9%), Pinal (1.3%), Santa Cruz (0.4%), and Yavapai (0.1%). Cochise County decreased in both 2021 and 2022 with a -0.5% change in 2022, while the remaining counties went from positive changes in 2021 to decreases in 2022. These were Mohave (-0.2%), Navajo (-0.5%), Gila (-2.9%), Apache (-4.8%), Graham (-8.2%), La Paz (-8.6%). Greenlee County had the largest gap, going from an increase of 23.9% in 2021 to -16.2% in 2022. Nationally, the percent change in real GDP for 2022 ranged from a drop of 57.6% in Kiowa County, CO to an increase of 71.1% in Chouteau County, MT. –Valorie Rice
U.S. house prices rose 3.9% over the year in September, up from the 2.5% figure presented in August, based on the S&P CoreLogic Case-Shiller November 28th release. On the other hand, both Phoenix and Las Vegas showed over-the-year decreases in home prices, with Phoenix representing a -1.2% yearly change and Las Vegas -1.9%. The only other of the 20-city composite that showed an over-the-year decrease was Portland at -0.7%. Detroit showed the largest increase in home values, at 6.7%, followed by San Diego at 6.5% and New York at 6.3%.–Delaney O’Kray-Murphy
House prices increased in every state but Hawaii between the third quarter of 2022 and third quarter of 2023 according to the latest Federal Housing Finance Agency (FHFA) release. House price appreciation in Arizona was 1.9% over the year in the third quarter of 2023, lower than the national price change of 5.5%. New England states of Vermont and Maine had the largest appreciation during the period with 11.8% and 11.1% respectively. These data represent the purchase-only index while metropolitan area data are available with the all-transactions index, which includes purchase and refinance mortgages. Ranked by the one-year change in house prices, Arizona metropolitan areas in the third quarter of 2023 were: 5.7% in Yuma, 4.5% in Flagstaff, 3.1% in Tucson, 3.0% in Sierra Vista-Douglas, -0.5% in Prescott Valley-Prescott, -0.8% in Lake Havasu City-Kingman, and -1.7% in Phoenix. When included in the all-transaction index, the one-year price changes for Arizona and the U.S. move down to -0.4% and 4.8% respectively. –Valorie Rice
In October, Arizona over-the-year building permits saw a 32.0% increase to 5110, not seasonally adjusted. The number of single-family permits similarly saw notable over-the-year gains, increasing 76.0% from last October to 3275. The Phoenix metropolitan area accounted for most of the permits issued in the state, with 3955, a 37.6% increase. The number of single-family permits additionally rose 106.7% to 2375. The Tucson MSA additionally saw healthy growth, with total permits rising 21.8% to 425 and single unit permits by 20.7% to 333. Of the counties, Apache, Maricopa, Mohave, Pinal, Yavapai, and Yuma saw increases, while Cochise, Coconino, Graham, Gila, and Navajo saw decreases. No changes were observed in La Paz and Santa Cruz. –Delaney O’Kray-Murphy
More than three-quarters of the population over the age of 5 in the U.S. spoke only English at home (78.3%) according to the latest U.S. Census Bureau American Community Survey (ACS) 5-year estimates released December 7. For Arizona, that figure was just a bit less than three-quarters, at 73.6%. Arizona and the nation shared two of the top three languages other than English spoken at home, with Spanish being the largest by far at 61.1% for the nation and 75.8% for Arizona. Chinese (including all dialects) was the second most spoken language at home for the nation at 5.1%, but the third in Arizona at 1.9%. Navajo, at 4.5%, was the second most spoken language at home in Arizona. The third most spoken language in the U.S. was Tagalog (including Filipino) at 2.5%. –Valorie Rice
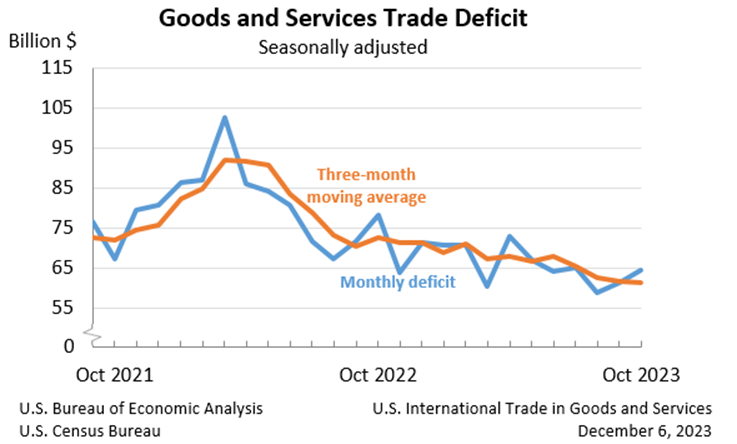
The October goods and services trade deficit came in at $64.3 billion, up $3.1 billion from a revised $61.2 billion in September. October exports fell $2.6 billion from September to reach $258.8 billion. Conversely, October imports had a $0.5 billion increase over the month to $323.0 billion. The increase in the deficit reflects an increase in the goods deficit of $3.5 billion to $89.8 billion and an increase in the services surplus of $0.4 billion to $25.5 billion. Over the year, the goods and services deficit decreased $161.4 billion, or 19.8%. Exports increased $28.0 billion (1.1%), and imports decreased $133.4 billion (4.0%). South and Central America ($21.8), Netherlands ($14.6), and Australia ($8.3) had the greatest surpluses, while China ($63.8), Mexico ($39.1), and the European Union ($26.5) have the greatest deficits (in billions). –Delaney O’Kray-Murphy
The U.S. unemployment rate edged down in November to 3.7% while total nonfarm payroll jobs increased by 199,000, according to the Bureau of Labor Statistics December 8th employment situation summary. Job gains occurred in health care (+77,000), government (+49,000), and manufacturing (+28,000), reflecting the return of strike workers. Additionally, employment in leisure and hospitality (+40,000) and social assistance (+16,000) both trended up in November. Employment decreased in retail trade (-38,000). In November, average hourly earnings for employees on private nonfarm payrolls increased by 12 cents (0.4%) to $34.10. Over the year, average hourly earnings have risen by 4.0%. The average workweek for private nonfarm employees edged up by 0.1 hour to 34.4 hours. This release also revised down the total nonfarm employment in September by 35,000, from +297,000 to +262,000. –Delaney O’Kray-Murphy
In October, over-the-year metropolitan unemployment rates were higher in 223 of the 389 metropolitan areas, lower in 137, and unchanged in the remaining 29. The October unemployment rates for the Tucson and Phoenix metropolitan areas came in at 4.3% and 3.9%, respectively. Yuma had the highest unemployment rate in Arizona at 14.8%, while Phoenix and Prescott tied for the lowest. Bismark, ND, had the lowest unemployment rate in the nation at 1.4%, followed by Fargo, ND-MN, at 1.5%. On the other hand, El Centro, CA, had the highest unemployment rate at 19.3%. Newark, NJ-PA, saw the most significant over the year rate increase, going up 1.6 percentage points, while Lawrence-Methuen Town-Salem, MA-NH; Peabody-Salem-Beverly, MA; and Silver Spring-Frederick-Rockville, MD, experienced the greatest rate decrease at -0.9 percentage points. –Delaney O’Kray-Murphy
The October 2023 release of the Job Openings and Labor Turnover (JOLTS) report stated that the number of job openings in the U.S. decreased to 8.7 million, while the job openings rate decreased to 5.3%. The industry that saw the largest increase in job openings was information with +39,0000. The industries that saw the largest decrease were health care and social assistance with -236,000 and finance and insurance with -168,000. Nationally, the number of hires changed little at 5.9 million, with a rate of 3.7% for October, 3.8% for September, and 3.7% for August. Total separations in the nation were little changed at 5.6 million, with a rate of 3.6%. The number of quits changed little at 3.6 million with a rate of 2.3%. The number of layoffs and discharges changed little at 1.6 million and 1.0%. The number of other separations in the U.S. was little changed, reporting at 377,000. –Alex Jaeger


