

EBRC Research Staff
Current data releases as of 2 February 2024
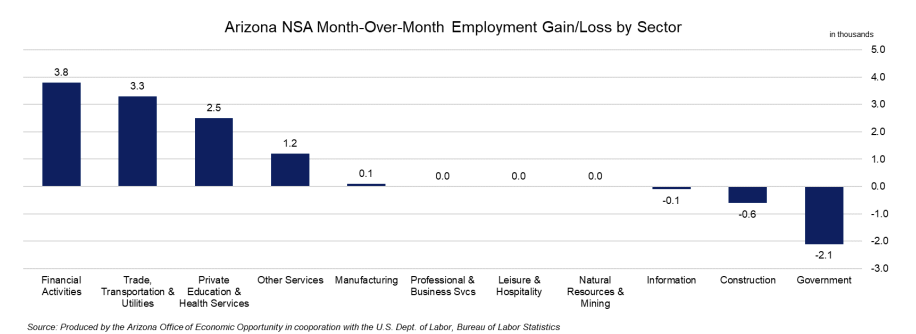
Total nonfarm employment in Arizona increased by 64,800 jobs over the year in December, with the seasonally adjusted unemployment rate remaining at 4.3%. Arizona’s seasonally adjusted total nonfarm employment of 3,189,300 in December 2023 is the highest in state history. Arizona non-seasonally adjusted total nonfarm employment increased by 8,100 jobs, beating the pre-pandemic average of 5,600. Employment gains were reported in financial activities (3,800); trade, transportation, and utilities (3,300); private education and health services (2,500); other services (1,200); and manufacturing (100). Employment losses were seen in government (-2,100), construction (-600), and information (-100). Over the year, government had the greatest gains (21,800), and Information the greatest decreases (-2,900). –Delaney O’Kray-Murphy
In December, over-the-month state unemployment rates were higher in 15 states, lower in one state, and stable in the remaining 34 and the District of Columbia. Arizona’s unemployment rate was stable over the month but came in 0.3 percentage points higher than last December. Maryland and North Dakota had the lowest jobless rate at 1.9%, while Nevada had the highest at 5.4%. Eighteen states and the District of Columbia experienced over-the-year unemployment rate increases, 15 observed decreases, and the remaining 17 saw little to no change. Over the year, Arizona observed a 2.1% increase in employment, rising 66,700 from 3,122,600 to 3,189,300. –Delaney O’Kray-Murphy
The U.S. unemployment rate arrived in January unchanged for the third month in a row at 3.7% while total nonfarm jobs rose by 353,000, according to the U.S. Bureau of Labor Statistics February 2nd employment situation summary. Job gains occurred in professional and business services (74,000), health care (70,000), retail trade (45,000), government (36,000), social assistance (30,000), manufacturing (23,000), and information (15,000). Employment in mining, quarrying, and oil and gas extraction saw a 5,000 decline in January, and other major industries saw no significant changes. Average hourly earnings for private nonfarm employees rose 0.6%, or 19 cents, to $34.55. The average workweek decreases by 0.2 hours to 34.1 hours in January. This release also revised up November nonfarm employment by 9,000 and December by 117,000. –Delaney O’Kray-Murphy
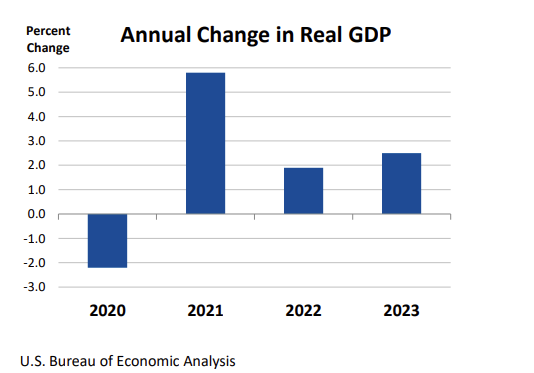
Real U.S. GDP increased at an annual rate of 3.3% in the fourth quarter of 2023 based on the advance estimate released by the U.S. Bureau of Economic Analysis on January 25. Increases in consumer spending and exports were reflected in the fourth quarter figure. In the third quarter of 2023, real GDP increased 4.9%. This release also included the annual real GDP figure for 2023, which rose 2.5% compared with an increase of 1.9% in 2022. A second estimate of gross domestic product based on more complete source data will be released on February 28. –Valorie Rice
House prices in Phoenix increased 2.5% over the year in November, contrasted with 0.9% in October. Nationally, the annual gain in house prices also accelerated in November at 5.1% compared to 4.7% in October, according to the most recent S&P Global CoreLogic Case-Shiller Indices release on January 30. The 20-city composite increased 5.4% over the year. Among the 20 cities tracked, Detroit posted the largest annual gain in house prices at 8.2%, followed by San Diego at 8.0%. Portland was the only city in the index to report lower year-over-year prices. Monthly data, however, indicated that 12 of the 20 cities had negative or flat price changes between October and November, including Phoenix with a -0.3% change. The November monthly U.S. price change was negative for the first time since January 2023. –Valorie Rice
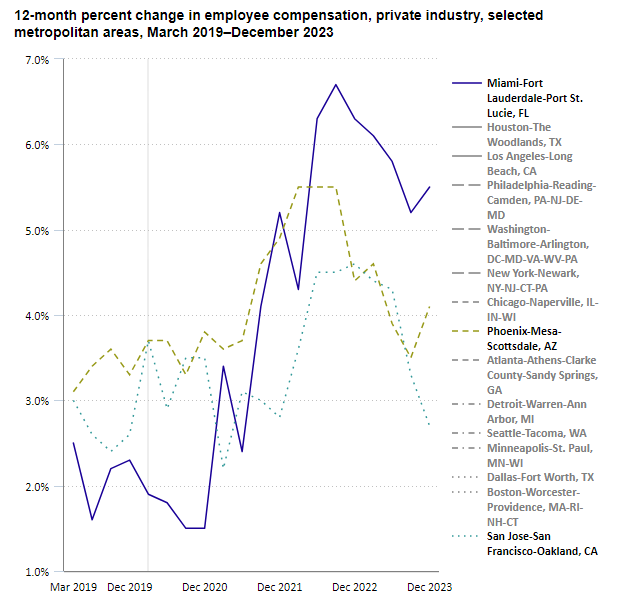
In December 2023, the Phoenix-Mesa-Scottsdale, AZ Metropolitan Statistical Area (MSA) reported a 4.1% increase over the year in total compensation for private industry workers. Wages and salaries experienced a slightly higher increase, reaching 4.4%. When benchmarked against other MSAs, the Miami-Fort Lauderdale-Port St. Lucie, FL MSA stood out in both total compensation and wages and benefits for private industry workers, reporting a 5.5% and 5.1% increase over the year, respectively. In contrast, the San Jose-San Francisco-Oakland, CA MSA reported the lowest increases, with total compensation and wages and salaries showing a modest uptick at 2.7% and 2.8%, respectively. Nationally, the U.S. Bureau of Labor Statistics revealed that the compensation costs for civilian workers increased by 4.2%, wages and salaries increased by 4.3%, and benefit costs increased by 3.8%. For private industry workers in the U.S., compensation costs increased by 4.1% over the year, and wages and salaries increased by 4.3%. Benefit costs for private industry workers increased by 3.6%, down from the prior year’s 4.8%. –Prarthana Magon
The December 2023 release of the Job Openings and Labor Turnover (JOLTS) report stated that the number of job openings in the U.S. changed little to 9.0 million, while the job openings rate was unchanged at 5.4% for the month. The industry with the largest increase in job openings was professional and business services at +239,0000. The industry having the largest decrease was wholesale trade at -83,000. The number of hires in December was 5.6 million, with a rate of 3.6% for December, little changed from 3.5% for November. Total separations in the nation changed little to 5.4 million, with a rate of 3.4%. The number of quits was 3.4 million with an unchanged rate of 2.2%. The number of layoffs and discharges changed little at 1.6 million with an unchanged rate of 1.0%. The number of other separations in the U.S. was little changed, reporting at 358,000. –Alex Jaeger
According to the January 18th State Job Openings and Labor Turnover (JOLTS) report, job openings rates decreased in four states, increased in two states, and were little changed in all other states. The job openings rates for Arizona were 5.7% for November, 5.5% for October, and 5.7% for September. The number of job openings decreased in five states, increased in four states, and was little changed in all other states. The largest decrease in the number of job openings was seen in Florida with -66,000 and Georgia with -36,000. Arizona was one of the states that saw an increase with +7,000. Hire rates decreased in five states, increased in one state, and little changed in all other states. Arizona was one of the states with the largest decrease in hire rates. Montana was the largest with -1.0% followed by Arizona and Oregon at 0.7%. The hire rates for Arizona were 3.7% for November, 4.4% for October, and 4.1% for September. The number of hires decreased in six states, increased in one state, and was little changed in all other states. Arizona was one of the six states that saw a decrease with -21,000 putting it at the second highest after California with -117,000. The number of layoffs and discharges decreased in 10 states, increased in one state, and were little changed in all other states. The largest decrease was seen in New Jersey with -48,000 and Pennsylvania with -45,000. Nationally, the layoffs and discharges rates and total separations rates were little changed. –Alex Jaeger


