11/22/2019
10/22/19
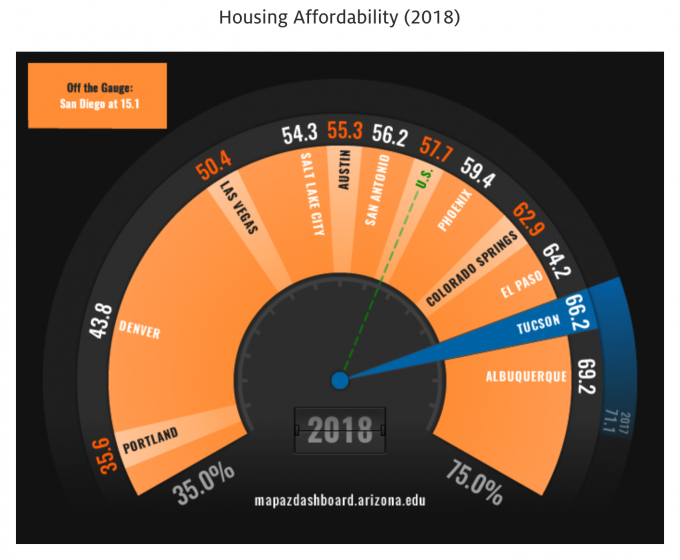
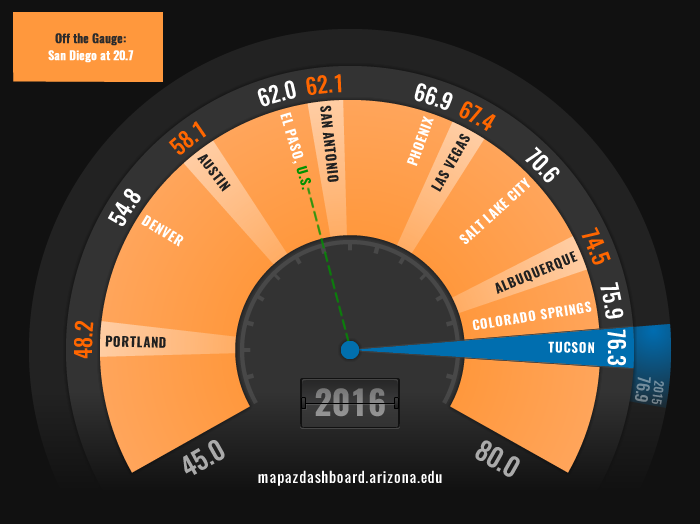
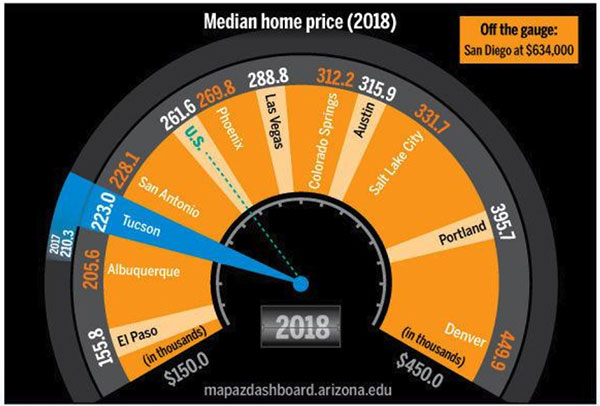
More on this topic in the MAP Dashboard article Affordable Housing in Tucson? It Depends
7/22/19
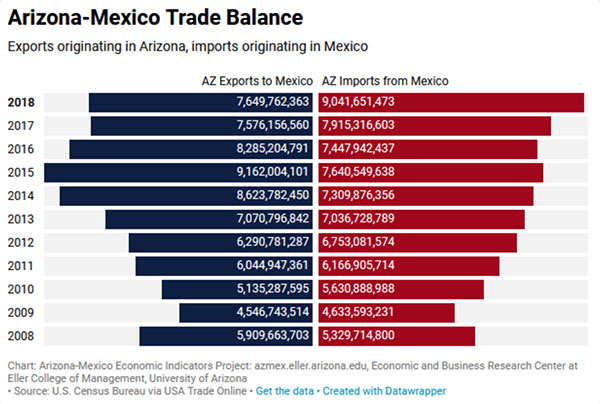
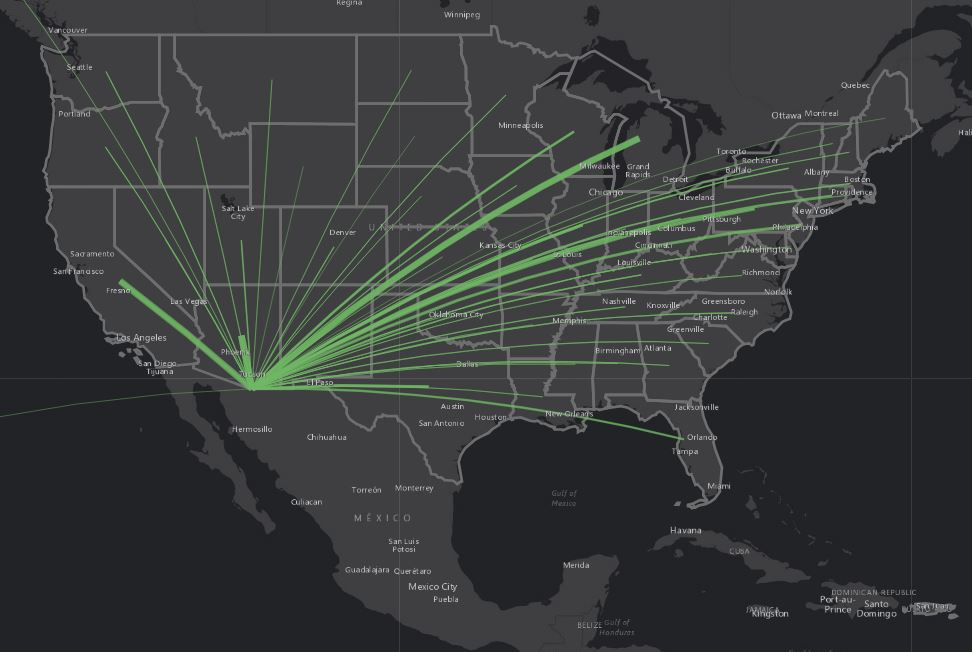
Visit EBRC’s Arizona-Mexico Economic Indicators website for more on Arizona-Mexico trade.
6/6/19
Visit EBRC’s Arizona-Mexico Economic Indicators website for more on Arizona-Mexico trade.
6/1/19
1/15/19
12/3/18
9/19/18
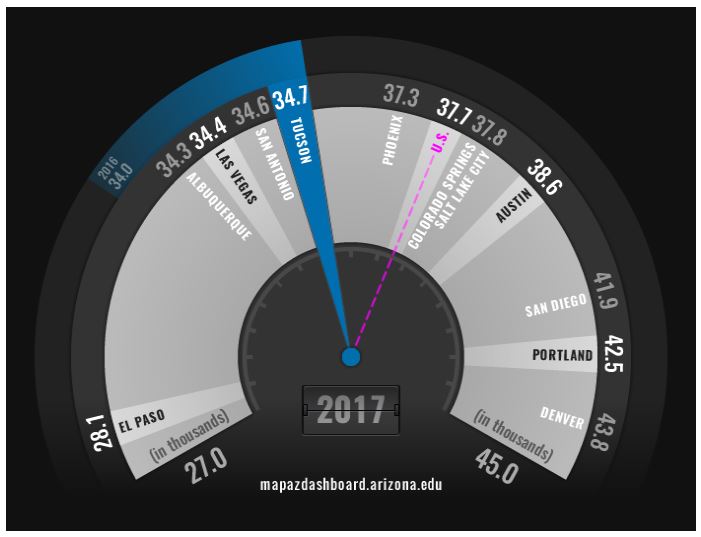
In 2017 the U.S. median wage for all occupations was $37,690 and for Arizona statewide it was $36,270. Phoenix, with a median wage of $37,280, was higher than the state but still trailed the nation. Tucson’s median wage in 2017 was $34,650.
8/1/18
7/9/18
7/2/18
Health Insurance Coverage Rates (2016) for Select Western Metros
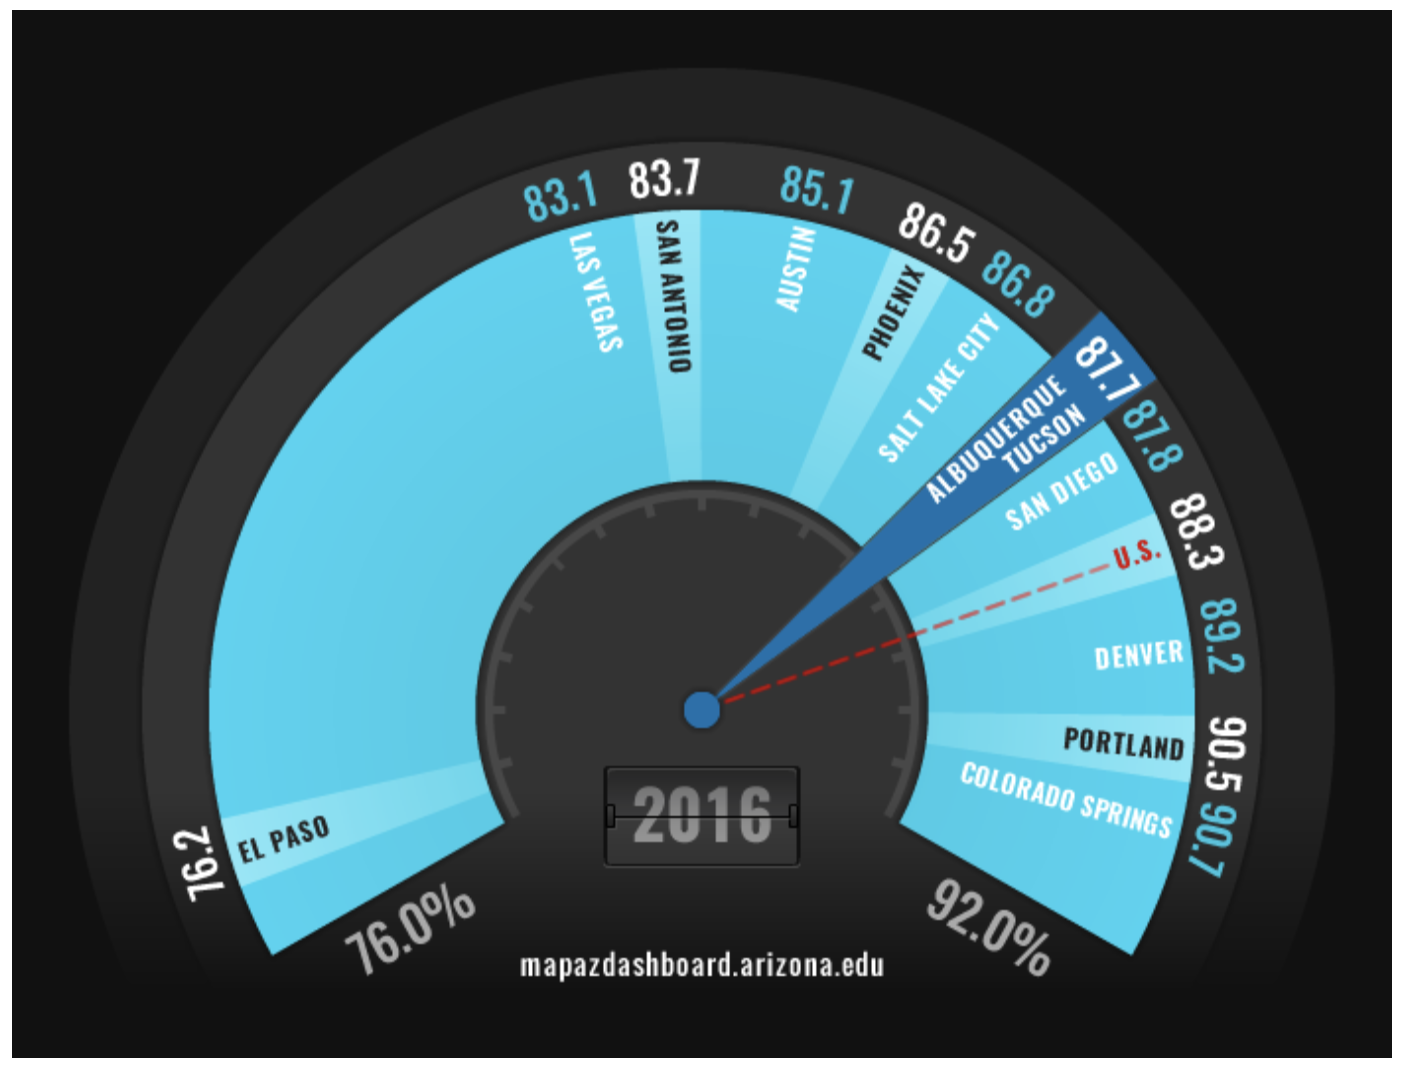
Tucson ranked fifth (87.7%), tied with Albuquerque, and Phoenix (86.5%) came in seventh when compared to 12 western metropolitan areas in health insurance coverage in 2016. Colorado Springs, Portland, Denver and San Diego had higher percentages of residents with health insurance. Read full analysis on the MAP Dashboard.
6/28/18
6/21/18
A More Diverse Nation
 [Source: U.S. Census Bureau]
2/5/2018
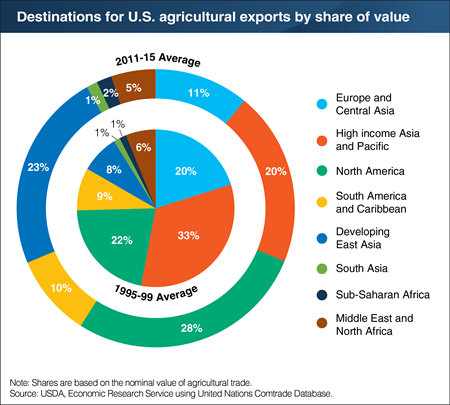
The regional composition of U.S. exports has shifted toward developing East Asia over time
1/24/18
1/17/18
 [Source: U.S. Census Bureau]
12/20/17
 [Source: U.S. Census Bureau]
12/14/17
 [Source: U.S. Census Bureau]
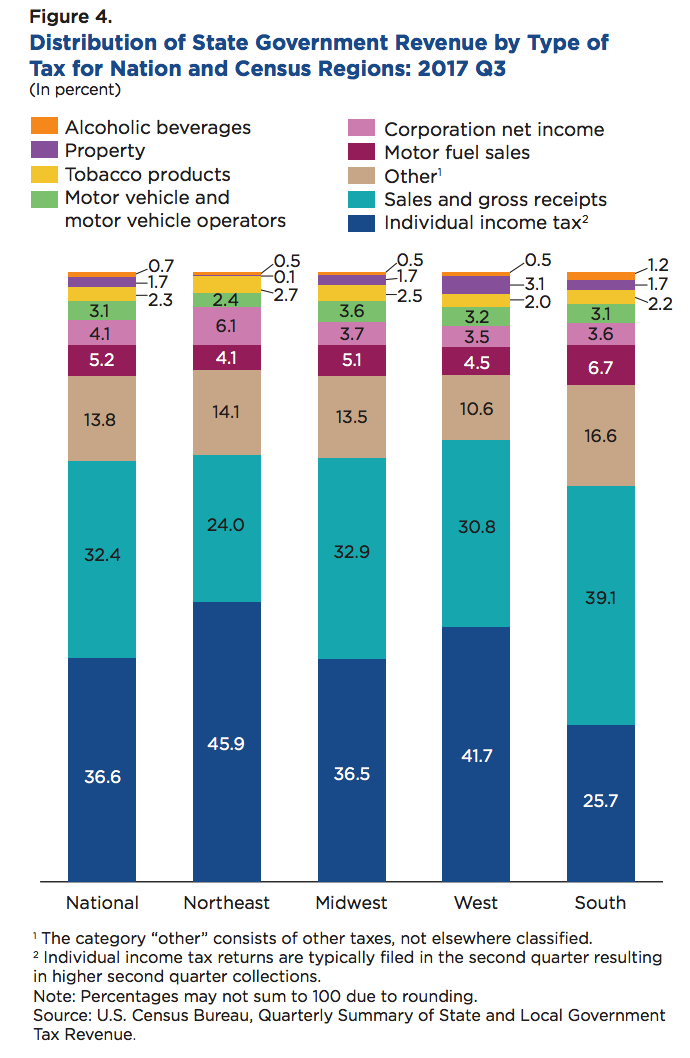