
by George W. Hammond, Ph.D.
EBRC Director and Research Professor
August 31, 2018
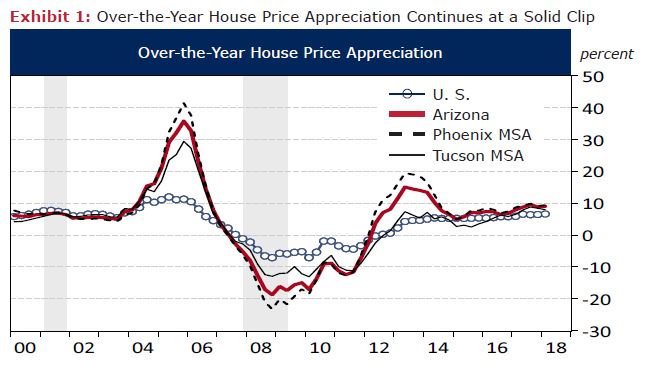
Arizona single-family house prices rose 9.0% over the year in the first quarter of 2018, according to data from the Federal Housing Finance Agency. These data measure repeat sales of single-family homes and thus are not subject to the same distortions that affect median house price measures. U.S. house prices increased 6.6% over the year. House prices in the Phoenix Metropolitan Statistical Area (MSA) increased 9.3% while prices in the Tucson MSA rose 7.9%. As Exhibit 1 shows, house prices have been gradually accelerating, but are still rising at a slower pace than during 2012-2013.
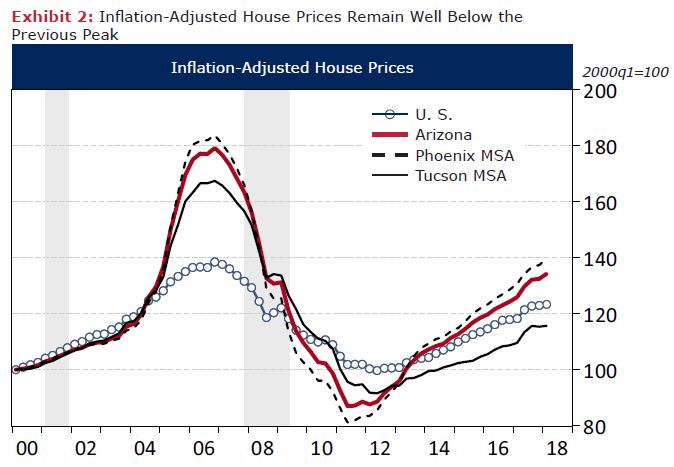
House prices are again outpacing inflation by a substantial margin. After adjusting for inflation, using the U.S. All Cities All Items CPI-U, state house prices increased by 6.6% over the year in the first quarter, which outpaced the U.S. rate of 4.3%. Real house prices in the Phoenix MSA rose 6.9% over the year, while Tucson MSA prices increased 5.6%.
However, as Exhibit 2 shows, real house prices remain well below previous peak levels. Note that U.S. real house prices are still 10.9% below their peak. Arizona prices remain 25.1% below peak, while house prices in the Phoenix and Tucson metropolitan areas are 24.0% and 30.9% below peak, respectively.
House prices have also been rising faster than incomes. One measure of this is the single-family housing affordability data from the National Association of Home Builders. They use monthly sales transaction records to collect home price data and then convert that into a monthly payment including principal, interest, and taxes based on a 30-year fixed rate mortgage with a loan for 90% of the sale price. This value is then compared to median family income. They assume that a family can afford to spend 28% of gross income on housing. Finally, they report the share of sales that are affordable based on these calculations and assumptions.
Exhibit 3 shows housing affordability results for 12 western metropolitan areas and the U.S. According to this measure, the Tucson MSA had the most affordable single-family housing last year, with 71.1% of homes sold judged to be affordable. That was well above results for the Phoenix MSA, at 65.7%, and the nation as a whole, at 59.3%. Housing affordability in San Diego was 19.4%, which was so low that it could not fit on the gauge.
Exhibit 3: Housing Affordability Was Above Average in Phoenix and Tucson
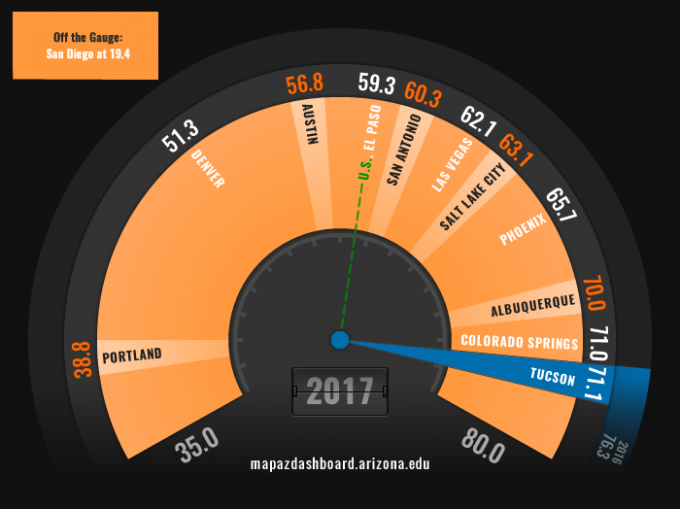
Exhibit 4 shows trends in housing affordability for Phoenix, Tucson, and the U.S. After recovering from lows in 2006, housing affordability has gradually been trending down, which indicates that house price appreciation has outpaced income growth. However, note that affordability remains well above lows achieved in 2006 and is essentially back to levels last seen in the early 2000s.
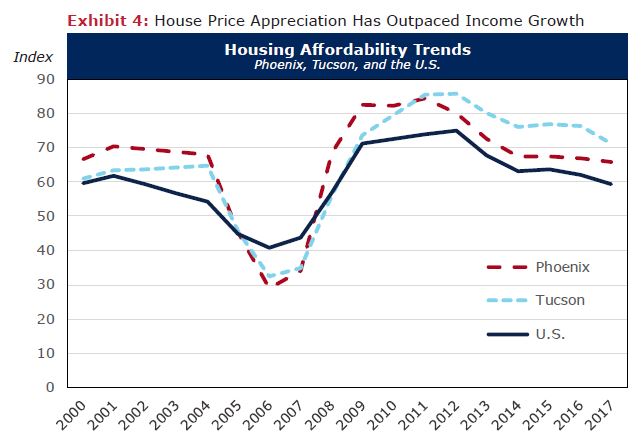
Overall, it is clear that single-family house prices are gaining momentum. They are rising faster than inflation and income, which has dragged down affordability. Even so, affordability remains well above recent lows and is back to levels seen in the early 2000s.