
By George W. Hammond, EBRC Director and Eller Research Professor
Large, high-cost metropolitan areas have experienced an increase in net out-migration to smaller, lower-cost metros…
Our just previous post “The Great COVID Urban Out-Migration” summarized a February report from the Cleveland Fed about the impact of the pandemic on urban migration in the U.S.
This post summarizes research using the same data to examine the impact of the pandemic on migration across metropolitan areas. The Cleveland Fed also recently convened a FedTalk webinar on this subject with the author. It is well worth listening to the recording.
Focusing on out-migration data from a set of high-cost large metropolitan areas: New York, Los Angeles, Chicago, Washington DC, Miami, Boston, San Francisco, Riverside, Seattle, San Diego, Denver, Portland, Sacramento, and San Jose results showed an increase in migration to smaller, lower cost metropolitan and non-metropolitan areas during the pandemic, compared to migration during the 2017-2019 period. Both a drop in migration to large, high-cost metropolitan areas and an increase in migration away from those areas were evidenced.
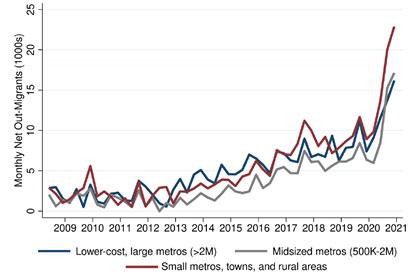
Exhibit 1 shows net out-migration from large, high-cost metropolitan areas by destination region type. Note that net out-migration from large, high-cost metropolitan areas was already trending up when the pandemic hit. After the pandemic began, net out-migration increased significantly to large, lower-cost metropolitan areas (+2 million residents), mid-sized metropolitan areas (500,000-2 million residents), and particularly for small metropolitan areas, town, and rural areas.
Exhibit 1: Net Out-Migration from High-Cost, Large Metro Areas to Other Types of Regions
Many domestic migrants to Arizona come from southern California. The report shows that, relative to 2017-2019, net out-migration from Los Angeles to large, lower cost metropolitan areas increased by 9.4% during the pandemic. Out-migration increased by 15.0% to mid-sized metropolitan areas and by 10.8% to smaller metropolitan areas, towns, and rural areas. The estimated total out-migration from Los Angeles to all three types of areas during the pandemic was 150,580.
For San Diego, net out-migration to large, lower-cost metropolitan areas by 8.5%. Out-migration to mid-sized metropolitan areas increased by 8.2% and by 6.9% to smaller metropolitan areas, towns, and rural areas. The estimated total out-migration from San Diego to all three types of areas during the pandemic was 61,320.
The report also shows the result of a speculative exercise on the possible reallocation of remote workers across regions. The report estimates that there are 17.0 million telework-capable workers in the high-cost metropolitan areas. If 5% of remote workers leave their large, high-cost metropolitan area, that would translate into 862,000 migrants redistributed across the country. This could have substantial impacts on local labor forces, housing markets, and public services.
About the data:
Using the Federal Reserve Bank of New York/Equifax Consumer Credit Panel, a series of data reports found that migration patterns were significantly disrupted by the pandemic. The data resulted from a nationally representative anonymous random sample of 5 percent of U.S. consumers with a credit score (10 million adults). Since 9 out of 10 adults have credit records, the author argues that these data are more representative than many datasets underpinning media reports to date. The data reflect address changes reported monthly and geolocated to Census tracts.